
Scalable Apache JMeter Test Framework using Azure Kubernetes Service and Grafana

This testing framework provides a scalable test harness that you can use for load testing applications using Apache JMeter test scripts. The framework uses Azure Kubernetes Service (AKS) in a distributed architecture that can carry out an intensive load test, simulating hundreds and thousands of simultaneous users. The results of the load testing are sent to InfluxDB using the built-in backend listener available in JMeter. Grafana is used to render this data in an easily consumable dashboard.
The testing framework utilizes a master JMeter node, and one or more slave nodes are used to run the tests. This implementation deploys a single JMeter slave pod, but you can scale it as needed to support the required number of client threads.
To use this framework, you must have a JMeter test plan in the form of a .jmx file configured with a backend listener.
Architecture
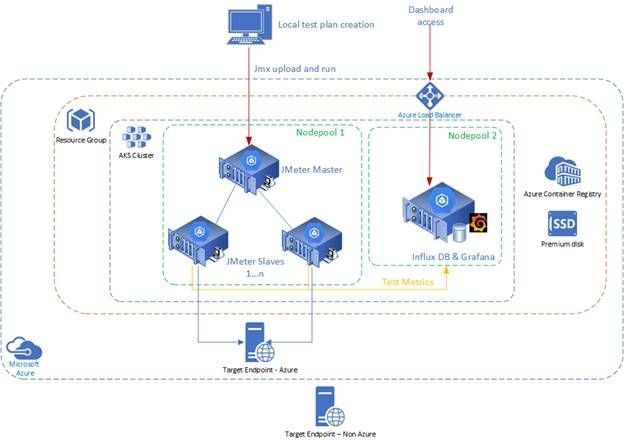
The framework uses a Kubernetes-based deployment of Apache JMeter, InfluxDB, and Grafana. AKS is a managed platform that makes it easy to set up a distributed architecture on Azure. The framework builds on Apache JMeter's distributed load testing model whereby tests are initiated from one JMeter master node, which then distributes the test script to the slaves (JMeter instances). The slaves are pods that carry out the load testing.
Note: The test plan is replicated to all slaves, so you must consider the overall client load. For example, a test plan with 100 client threads distributed to five JMeter slaves results in 500 active clients.
Install
To get started, set up the environment and prerequisites as follows:
- Make sure you have Azure CLI version 2.0.80 or above (assumes use of a Linux client, not PowerShell).
- Install kubectl.
- Clone the GitHub repo.
- Navigate to the installs directory.
- Make the install.sh script executable:
Run install.sh
You can use the install.sh script for installation, validation, and cleanup by using the following parameters:
- validate Validates the target environment and checks the resource group, service principal name, and AKS.
install.sh validate -g {resource-group-name} -s {service-principal-name} -l {location} - install Deploys to the target environment using the resource group and location defined. It creates the resource group, a service principal, and a repository in Azure Container Registry. Then it builds and uploads containers for the JMeter master, JMeter slave and reporting. A reporting node pool is created, followed by the creation an AKS cluster, and then all the elements required to run a test are deployed and configured.
install.sh install -g {resource-group-name} -s {service-principal-name} -l {location} - delete Removes all resources and the service principal.
install.sh delete -g {resource-group-name} -s {service-principal-name} - kube_deploy Deploys and configures all the Kubernetes elements required to deploy pods. It also configures InfluxDB and Grafana on an existing test framework cluster.
install.sh kube_deploy -g {resource-group-name} -c {aks-cluster-name}
Access the Grafana dashboard
After the deployment has completed successfully, you can go to the Grafana dashboard via the public IP address of the provisioned load balancer. The easiest way to obtain this address is to run:

Using the public IP address of the load balancer, you can then access the Grafana logon window. To log on, use the default credentials—admin for username and admin for password.

Set up the JMeter dashboard
When you start Grafana, a default data source is used to display an initial dashboard, which is loaded as part of the installation. To open the default dashboard that supports testing, select JMeter Dashboard.
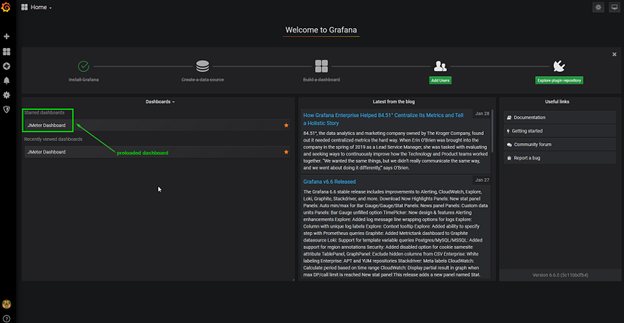
If no dashboard is available, follow the steps below to load a JMeter dashboard to display testing data:
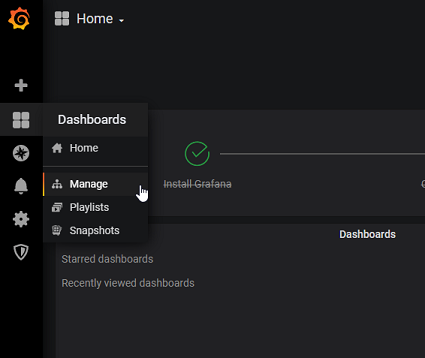
- Select Dashboards, then select Manage as shown:
- In the Dashboards window, select Import.
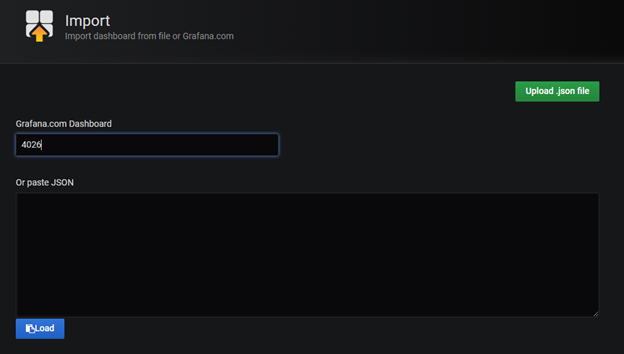
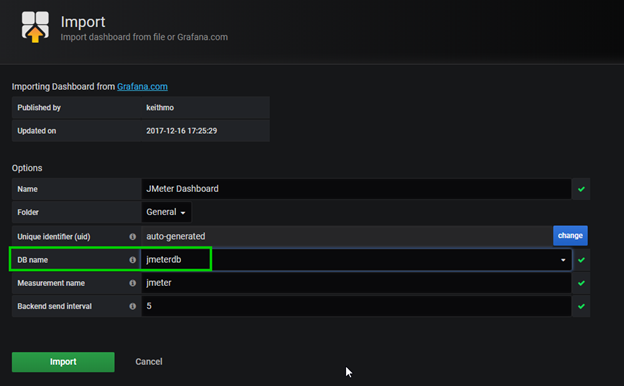
- In the Import window, enter 4026 to identify the dashboard from Grafana labs and then press Tab.
- In the settings options that appear, type jmeterdb for DB name, then click Import to load the dashboard with the default settings.

Use the Grafana dashboard
When the Grafana dashboard for JMeter is loaded, note the following items:
- Name (marked 1 in the following figure) is the application name and is linked to your JMeter test plan configuration.
- Start/Stop marker (2) indicates when a JMeter test starts and stops.
- Last 30 minutes (3) shows the time period for the data currently displayed on the dashboard.

Run your first JMeter test
To validate the deployment, a simple test script has been provided. To run this test, navigate to the deploy directory, then use the starttest.sh file as follows:
- Make the file starttest.sh executable:
chmod +x starttest.sh - Execute a test run:
./starttest.sh {testfilename}</li-code
For example, to execute the simple test script that’s provided:
The example output shows that the test plan is distributed to a single node (as this default implementation uses only one slave node).

If you navigate to the Grafana dashboard, you can see output data like the following, which shows a different time range and application name:

Write your own JMeter test plan
To set up your own JMeter test plan, refer to the Apache JMeter documentation. The key element to include in your test plan is a backend listener. To get real-time metrics, you must configure the JMeter backend listener to send data to InfluxDB.
To configure the backend listener in JMeter:
- On the Backend Listener screen, set the Backend Listener Implementation to the influxdb listener.
- Set the influxDb URL parameter to http://jmeter-influxdb:8086/write?db=jmeter.
- Set the application parameter to the name you want to use to filter results in the Grafana dashboard, such as test.
- Set the measurement parameter to jmeter.

You can also send your result data to log analytics using the Azure backend listener as described here
Run your own test plan
After creating your test plan using a local JMeter GUI instance, save a copy of the test plan to the deploy directory.
Run the test plan with:
Scale the test framework
This test framework is deployed with a single JMeter slave node, but you can scale out the deployment. To run a larger test with more slaves, use the following:
This command scales the number of slaves to the number specified. Note that the configuration is set to autoscale the cluster, and you must wait for the cluster to scale out. To check the status:
Troubleshooting notes
Remote slave does not start
Sometimes the remote slave cannot be contacted by the master node at test start. In this case, the IP address of the pod is the last one listed in the remote server list.
Use the IP address of the remote slave to find the pod as follows:
Published on:
Learn moreRelated posts
Large-scale docking for drug design on Azure
“Only 10 total drugs in 46 years have been intentionally developed for childhood cancer and have reached FDA approval (reference). Childhood ...
E2E deployment of a production ready NDv4 (A100) cluster targeting large deep learning training
Introduction The NDv4 series is very popular for running large deep learning training jobs, which require lots of floating-point perfo...
Performance considerations for large scale deep learning training on Azure NDv4 (A100) series
Background The field of Artificial Intelligence is being applied to more and more application areas, such as self-driving cars, natural langua...
Best Practice for Running Cadence Spectre X on Microsoft Azure
Co-authors: Richard Paw and Andy Chan Electronic Design Automation (EDA) consists of a set of software (tools) and workflows for design...
Spack in a Multi-User HPC Environment on Azure
Spack is a package management tool designed for HPC environments. In this article we will demonstrate how to install and configure Spack...
AzureHPC Lustre Marketplace Offer
The AzureHPC Lustre Marketplace offer provides a fast and easy way to deploy a Lustre Filesystem on Azure. The features include: Deplo...
Mainframe Migration to Microsoft Azure with Intel Architecture on Your Terms.
IntroductionMainframes are still in wide use today for business-critical applications in many industries. According to a 2021 survey by IBM, 7...
Why Organizations are Entrusting Microsoft Cloud with their Mainframes
There is a resurgence of interest and renewed priority to transform core enterprise systems. This resurgence is largely driven by rapidly shif...
Automated HPC/AI compute node health-checks Integrated with the SLURM scheduler
Overview It is best practice to run health-checks on compute nodes before running jobs, this is especially important for tightly coupl...
GPU Monitoring using Azure Monitor
Overview Today, many highly parallel HPC/AI applications use GPU to improve the run-time performance. It is important to be able to monitor t...