GPU Monitoring using Azure Monitor

Overview
Today, many highly parallel HPC/AI applications use GPU to improve the run-time performance.
It is important to be able to monitor the GPU metrics (e.g. GPU and memory utilization, tensor cores activity, temperature of GPU’s etc.) to determine if the GPUs are being used efficiently and predict any reliability issues.
Azure Monitor is an azure service that provides a platform to ingest, analyze, query and monitor all types of data. The primary advantage of using Azure Monitor to monitor your data is simplicity, you do not need to deploy any additional resources or install any extra software to monitor your data.
Here we give an example of how to use Azure monitor to monitor various ND96asr_v4 (A100 on Ubuntu-HPC 18.04) GPU metrics. Please note that the GPU monitoring procedures outlined in this blog post are very portable and can be used with other Azure GPU types (e.g NDv2 and NC series).
Which GPU metrics to use?
Nvidia Datacenter GPU Monitoring (DCGM) is a framework that allows access to several low-level GPU counters and metrics to help give insights to the performance and health of the GPU’s. In this example we will be monitoring counter/metrics provided by dmon feature. All DCGM metrics/counters can be accessed by a specific field id. To see all available field ids:
Note: The DCGM stand-alone executable dcgmi is pre-loaded on the ubuntu-hpc marketplace images.
Some useful DCGM field Ids
| Field Id | GPU Metric |
| 150 | temperature (in C) |
| 203 | utilization (0-100) |
| 252 | memory used (0-100) |
| 1004 | tensor core active (0-1) |
| 1006 | fp64 unit active (0-1) |
| 1007 | fp32 unit active (0-1) |
| 1008 | fp16 unit active (0-1) |
How to create a custom GPU Azure monitor collector
The python script gpu_data_collector.py show you how to connect to your log analytics workspace , collect various DCGM dmon metrics (by selecting the field Ids of interest) and send them at a specified time interval to your log analytics workspace.
Note: This script also collects SLURM job id and the physical hostnames (i.e. physical hosts on which this VM is running). By default, data is only sent to log analytics workspace if a SLURM job is running on the node (this can be overridden with the -fgm option).
This script can be started using a linux crontab (see -uc argumet), stand-alone or as a linux systemd service.
To connect to the log analytics workspace the customer_id and shared_key needed to be defined. (Customer ID (i.e. Workspace ID) and shared key (primary or secondary key) can be found in the Azure portal-->log analytics workspace-->Agents management).
You can either define customer_id and shared_key in the script or set with environment variables.
Note: if customer_id or shared_key is defined in this script, then the LOG_ANALYTICS_CUSTOMER_ID or LOG_ANALYTICS_SHARED_KEY environmental variables will be ignored.
Create GPU Monitor dashboard (with Azure Monitor)
You can go to the log analytics workspace you created in Azure and use kusto queries to create the GPU metrics charts you are interested in.
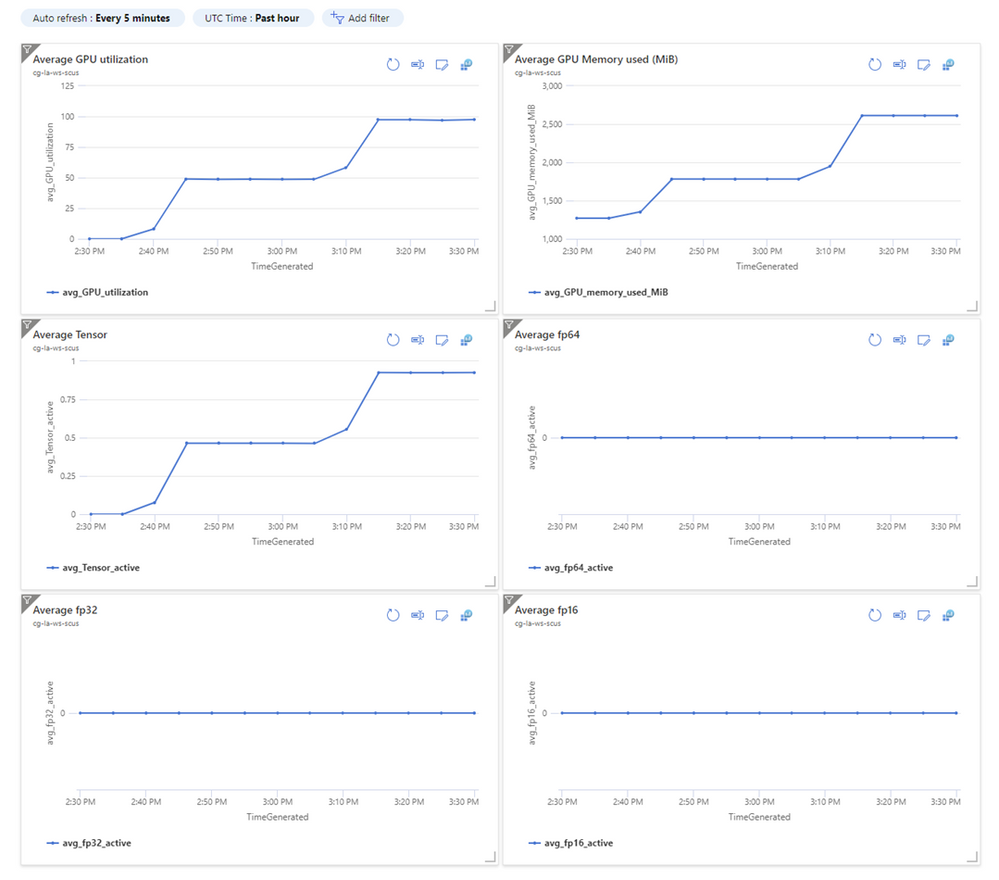
Here is a query to get the average GPU utilization of a particular SLURM job running on a virtual machine with GPU's.
You can then pin these graphs to your Azure dashboard to create a dashboard like the following.
Conclusion
It's important to provide GPU monitoring to gain insights into how effectively your application is using the GPU’s.
Azure monitor has some powerful monitoring capabilities and allows you to provide GPU monitoring without having to deploy additional resources or install extra software. An example client python code is provided that collects and sends GPU metrics to Azure Monitor, which can then be used to create a custom GPU monitoring dashboard.
Published on:
Learn moreRelated posts
Exponential backoff and circuit breaker for Service Bus-triggered Azure Functions
Use exponential backoff and circuit breaker patterns in Azure Functions with Service Bus SDK bindings. Control retry storms, protect dependenc...
May Patches for Azure DevOps Server
We are releasing new patches for our self‑hosted product, Azure DevOps Server. We strongly recommend that all customers stay up to date with t...
From beta to stable: Announcing the Azure SDK for Rust 🎉🦀
Announcing the stable release of the Azure SDK for Rust. This release includes stable libraries for Core, Identity, Key Vault (Secrets, Keys, ...

