
Monitoring serverless SQL ended requests by using Log Analytics.
Scenario
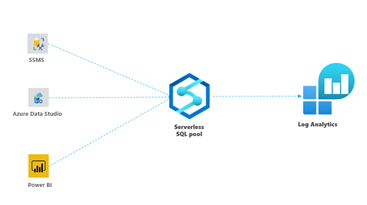
Today I would like to share a scenario that I was working on one of my serverless SQL Pool support cases. The customer asked for an advice on how to monitor serverless SQL requests by using log analytics.
The intention of this guide is to help you with choosing the configuration required to easily setup the Synapse Analytics Workspace monitoring and all other considerations about how to monitor serverless SQL requests with Azure Monitor. Spoiler: At the end of this article, I will share the latest version of the serverless workbook posted on the Azure_Synapse_Tool_Box. This includes a really cool way to see query execution information.
Before we start... here are some initial considerations.
Azure monitor provides base-level infrastructure metrics, alerts, and log for most Azure Services.
Metrics are numerical values that describe some aspects of a system at a particular point in time. It is the most important way to monitor data and gain insight into the performance counter.
Logs are events that occur in the system. They can contain different kinds of data and might be structured or freeform text with a timestamp. Logs in Azure Monitor are stored in a Log Analytics workspace that's based on Azure Data Explorer.
For Azure Synapse Analytics metrics, we have the following types:
- Workspace-level metrics
- Dedicated SQL pool metrics
- Apache Spark Pool metrics
To monitor some data from the Synapse Workspace operation, Azure Synapse Analytics writes the diagnostic logs in Azure Monitor.
For Azure Synapse Analytics logs, we have the following types:
- Workspace-level logs
- Dedicated SQL pool logs
- Apache Spark Pool log
You can find more information regarding Synapse metrics and logs in the following public reference: How to monitor Synapse Analytics using Azure Monitor - Azure Synapse Analytics | Microsoft Learn
At the moment when I was writing this article, the only way to read the logs emitted by Azure Synapse workspaces for serverless SQL requests is by querying the log analytics table name called SynapseBuiltinSqlPoolRequestsEnded.
On the table above, we can find the Synapse built-in serverless SQL Pool ended requests. It means that only sql requests succeeded or failed.
Now that you know a little bit about metric and logs, let's start creating the Synapse diagnostic settings to configure diagnostic logs for serverless sql requests workspace resource.
Environment
Pre-Requisites
Make sure you have at least one Log Analytics workspace to easily store, retain and query data collected from your monitored Synapse workspace resource.
Creating a Log Analytics workspace
Follow these steps below to set up a new Log Analytics workspace:
1. From Azure Portal, in the search bar on top of your portal, search for Log Analytics workspace.

2. From the Log Analytics workspaces page -> "+ Create".
3. Provide the project and instance details: Subscription, resource group, name and region. "Review and Create".
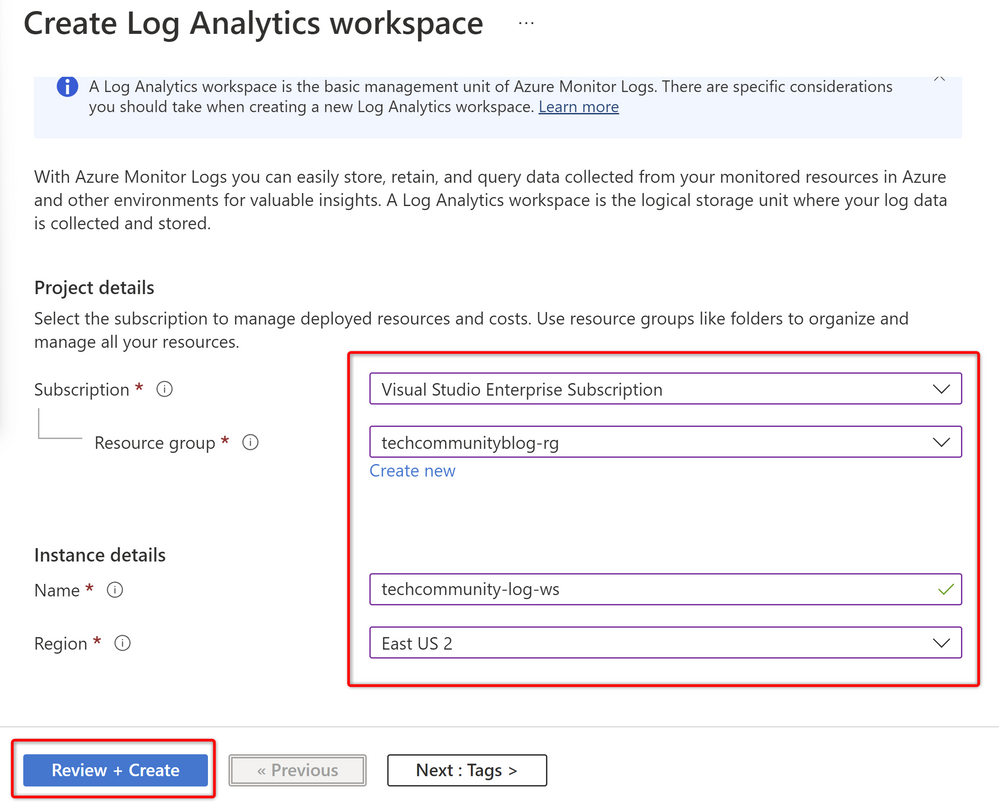
Creating a Log Analytics workspace
Follow these steps below to set up a new diagnostic setting and use the Log Analytics workspace to monitor Synapse logs:
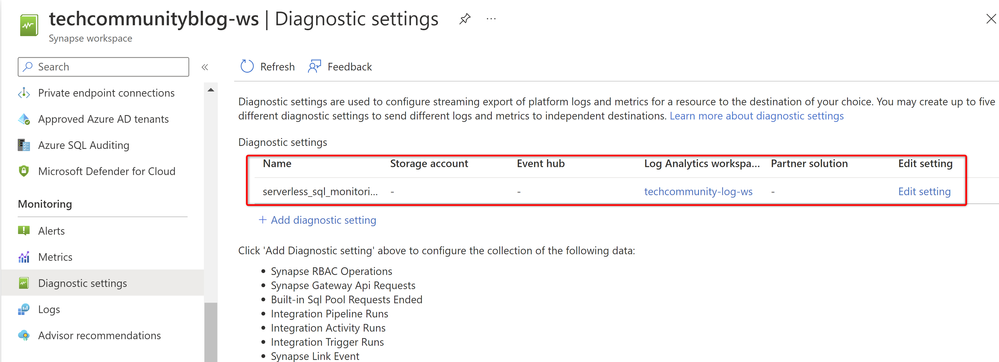
1. From the Azure Portal, open the Synapse Workspace page that you would like to monitor. From the left-menu, "Monitoring" -> "Diagnostic settings" -> "Add diagnostic setting"
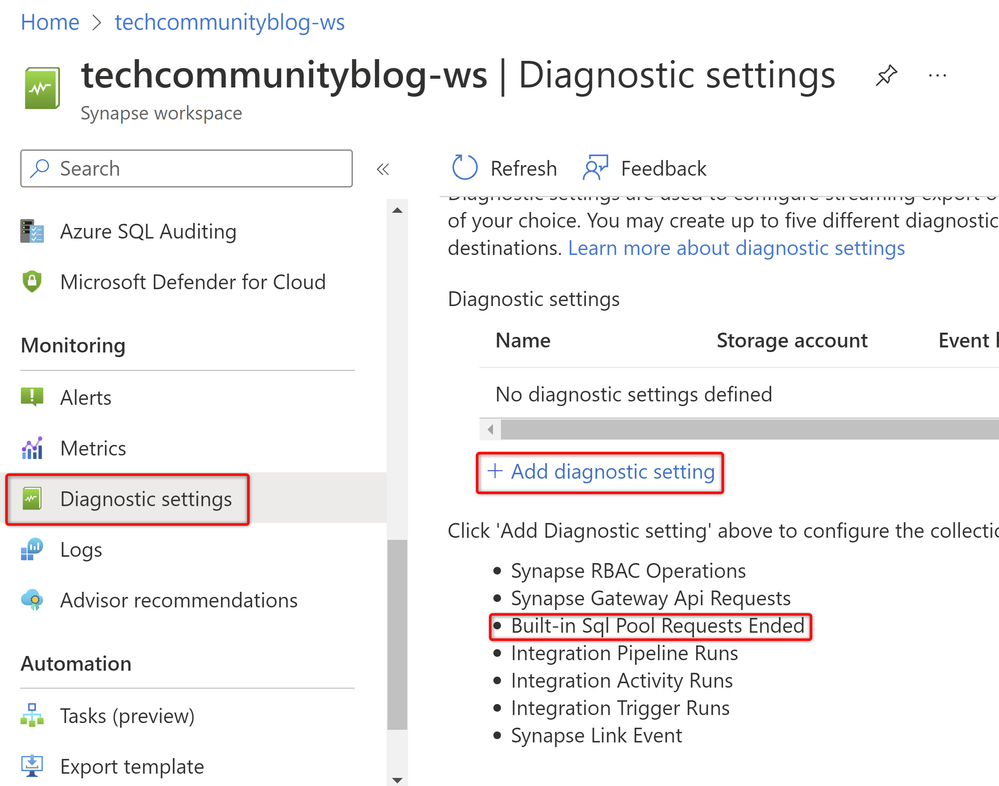
We can see in the image above, some collection of data that can be logged.
2. From the "logs categories" choose the built-in Sql Pool Requests Ended and on "Destination details" check the "Send to Log Analytics workspace" box and select the workspace already created. Type the "Diagnostic setting name" and "Save" the diagnostic settings.
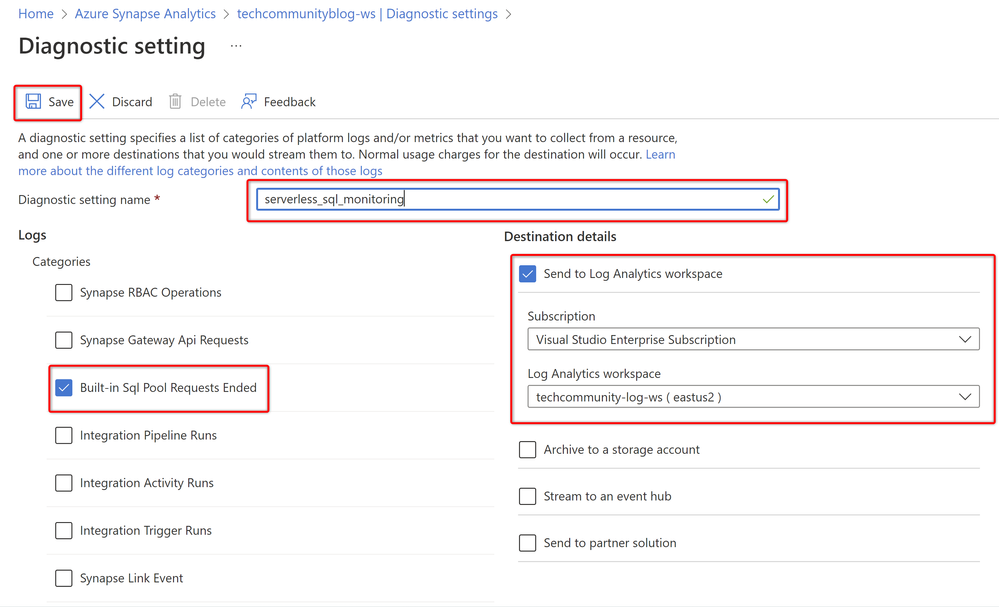
3. After a few moments, the new setting appears in your list of settings for this resource.
Monitoring the serverless sql requests from Synapse Studio
Follow these steps below to query logged data from log analytics to monitor serverless sql requests:
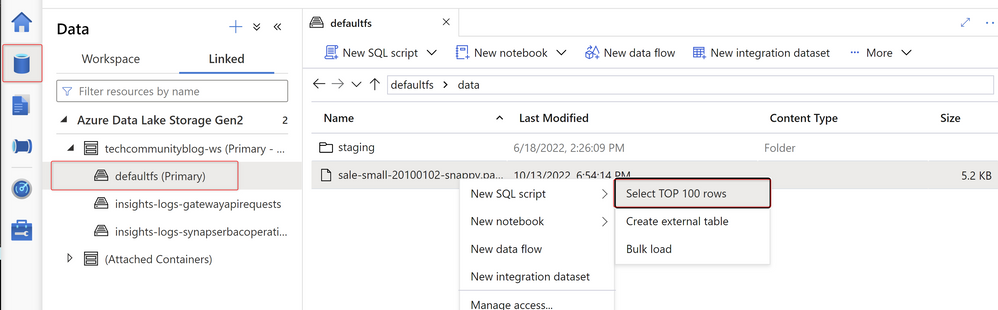
1. Let's start to query a sample data from data lake storage by using OPENROWSET function in Synapse Studio page.

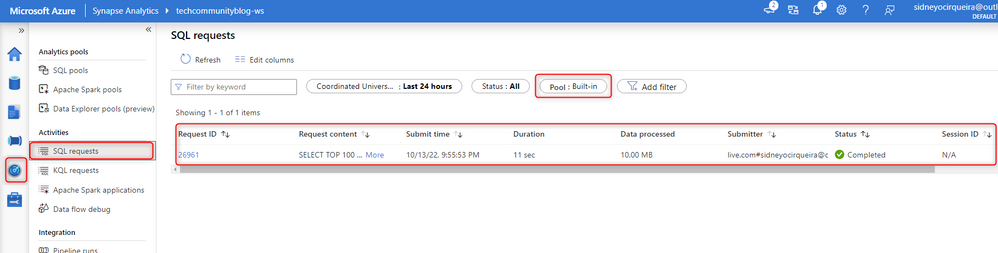
2. Let's check by using Synapse Studio to monitor the SQL requests to view the sql requests details about this specific query above.
Querying the serverless sql ended requests from Log Analytics
1. Go back to your Synapse workspace page, in the left-menu, "Monitoring" -> "Logs". Close the query recommendation if it pops-up on the workspace.
Select the "SynapseBuiltinSqlPoolRequestsEnded" table, type the table name and "Run" the simple KQL query below.
As a result of my log analytics environment, I have the following query result.
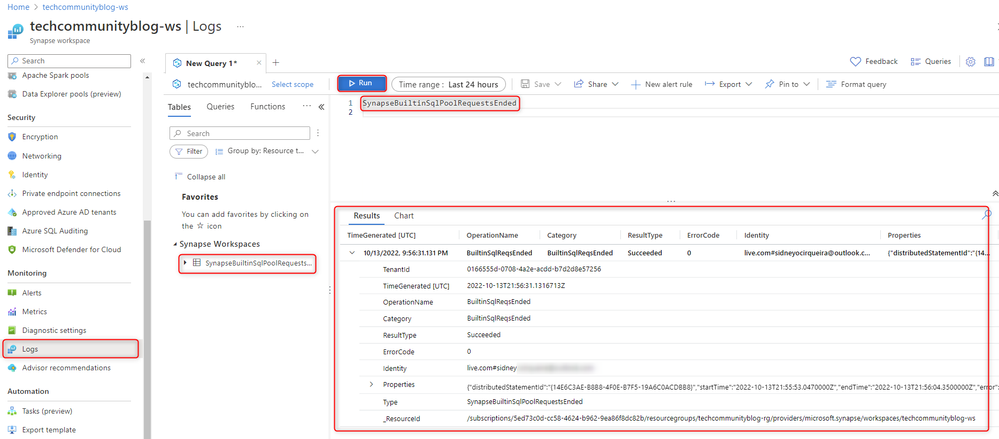
We can see on the screenshot above a lot of interesting fields which can be used to gain insight from serverless sql requests. Here we have the complete list of columns, type and description of the data which can be used to find information regarding serverless SQL query.
Feel free to use these KQL scripts below to start looking at some interesting sql requests ended results. #Enjoy
Let's go to the icing on the cake:
The Azure Synapse Toolbox is a place for useful tools and scripts to use with Azure Synapse Analytics. There you can find a lot of rich workbook templates to monitor all your Synapse environment.
Now let's focus on the serverless workbook which will includes query execution information including costing.
As pre-requisite you must have 'diagnostic settings' enabled at the workspace level to send 'BuiltinSqlReqsEnded' to Log Analytics. I have already proceeded with these settings. If you do not have it enabled, please go back to the begin of this article and follow all steps.
Follow the steps below to setup the serverless workbook. More information here.
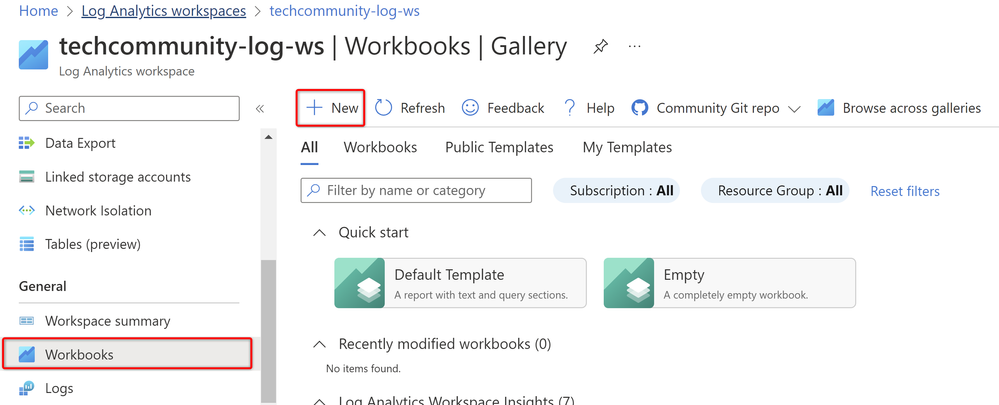
1. From Azure Portal, search for your log analytics workspace, from the log analytics page go to left-menu "General" -> "Workbook" -> "+ New".
2. Click on "</>" (advanced editor).

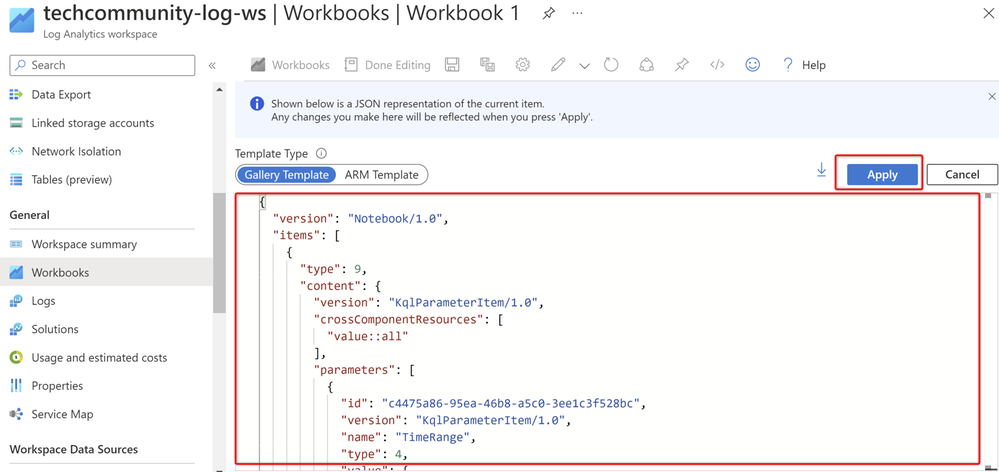
3. Overwrite the code shown on the gallery template with the content available here. Select all content of the git page and paste on the gallery template, and then "Apply".
4. Click on "Save As" and provide the Title for your workbook.

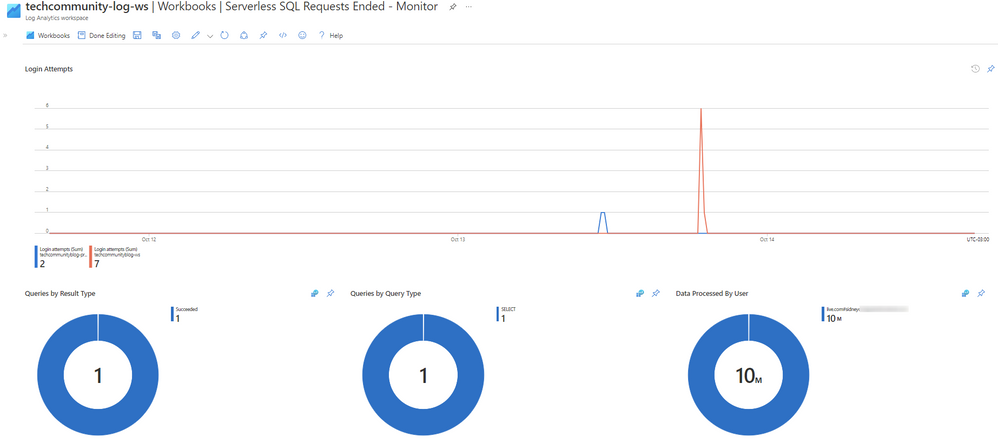
And finally, you are ready to enjoy of the rich metrics and logs monitoring capability by using workbooks. 


Conclusion
When using the Serverless SQL Pool to run your queries, users can take advantage of the diagnostic logs to monitor sql ended requests data efficiently. The log analytics provides a really simple way to run KQL queries and gain useful insight about sql query execution.
References:
Diagnostic settings in Azure Monitor
Use Azure Monitor with your Azure Synapse Analytics workspace
Note: Thank you Silas Mendes for reviewing it.
If you are unable to complete the steps in the article, please do reach out to us by logging a Support Request.
SIDNEY CIRQUEIRA
Synapse Analytics Support Engineer - Americas
Published on:
Learn moreRelated posts
We're moving!
We’re moving to the Analytics on Azure Tech Community! All new Azure Synapse Analytics content will be published there. In the next few days a...
Upgrade to Azure Synapse runtimes for Apache Spark 3.4 & previous runtimes deprecation
It is important to stay ahead of the curve and keep services up to date. That's why we encourage all Azure Synapse customers with Apache ...
ADF\Synapse Analytics - Replace Columns names using Rule based mapping in Mapping data flows
In real time, the column names from source might not be uniform, some columns will have a space in it, some other columns will not. For exampl...
Interpreting Script activity output json with Azure Data Factory\Synapse analytics
Script activity in Azure Data Factory\ Synapse analytics is very helpful to run queries against data sources mentioned here in this document.&...
Synapse Connectivity Series Part #4 - Advanced network troubleshooting and network trace analysis
Continuing the series of this blog posts I would like to go more advanced on troubleshooting connectivity issues. I would like to thank also&n...
Boost your CICD automation for Synapse SQL Serverless by taking advantage of SSDT and SqlPackage CLI
Introduction Azure Synapse Analytics Serverless SQL is a query service mostly used over the data in your data lake, for data discovery,...
Metadata-Based Ingestion in Synapse with Delta Lake
Overview The crucial first step in any ETL (extract, transform, load) process or data engineering program is ingestion, w...
Missing Fields Added to Dedicated SQL pool Diagnostic Settings Logs
Over the past year, customers have informed the team there were a set of key columns missing in the standalone Dedicated SQL pools (formerly S...
Using Azure DevOps with Synapse Workspaces to create hot fixes in production environments
Have you ever deployed a release to production only to find out a bug has escaped your testing process and now users are being severely impact...
Azure Synapse MVP Corner - March 2023
About this blog series Microsoft Most Valuable Professionals, or MVPs, are technology experts who passionately share their knowledge with the ...