Synapse Connectivity Series Part #4 - Advanced network troubleshooting and network trace analysis
Continuing the series of this blog posts I would like to go more advanced on troubleshooting connectivity issues. I would like to thank also Salam Al Hasan (@Salamalhasan) that helped me with some real case scenarios from our customers.
This is part 4 of a series related to Synapse Connectivity - check out the other blog articles:
- Synapse Connectivity Series Part #1 - Inbound SQL DW connections on Public Endpoints
- Synapse Connectivity Series Part #2 - Inbound Synapse Private Endpoints
- Synapse Connectivity Series Part #3 - Synapse Managed VNET and Managed Private Endpoints
In this post I will speak about how to capture a network trace and how to do some basic troubleshooting using Wireshark to investigate connection and disconnection issues, not limited to samples error messages below:
- An existing connection was forcibly closed by the remote host, The specified network name is no longer available, The semaphore timeout period has expired.
- Connection Timeout Expired. The timeout period elapsed while attempting to consume the pre-login handshake acknowledgement. This could be because the pre-login handshake failed or the server was unable to respond back in time. The duration spent while attempting to connect to this server was - [Pre-Login] initialization=5895; handshake=29;
- A connection was successfully established with the server, but then an error occurred during the pre-login handshake. (provider: TCP Provider, error: 0 - The semaphore timeout period has expired.)
- A connection was successfully established with the server, but then an error occurred during the login process
- Failed to copy to SQL Data Warehouse from blob storage. A connection was successfully established with the server, but then an error occurred during the login process. (provider: SSL Provider, error: 0 - An existing connection was forcibly closed by the remote host.) An existing connection was forcibly closed by the remote host
Index
- 0 - Scoping
- 1 - How to CAPTURE a network trace
- 1.1 - Input
- 1.1.1 - Capture filter
- 1.2 - Output
- 1.2.1 - Reproducible error?
- 1.2.2 - Transient error?
- 1.3 - Options
- 1.1 - Input
- 2 - Capture Alternatives
- 2.1 - NETSH - Native on Windows
- 2.2 - TCPDUMP - Native on Linux / MacOs
- 3 - Tool configuration - Wireshark
- 4 - Analysis
- 4.1 - SCENARIO 1 - Success path
- 4.1.1 - Simple sample on Wireshark
- 4.1.2 - Direction of the packages
- 4.1.3 - Redirect
- 4.2 - SCENARIO 2 - The server was not found or was not accessible
- 4.3 - SCENARIO 3 - Redirect port 11xxx range closed
- 4.4 - SCENARIO 4 - Connection timeout (Middle connection) / PreLogin handshake
- 4.4.1 - SCENARIO 4.1 - TLS Blocked
- 4.4.2 - SCENARIO 4.2 - Long connection
- 4.4.3 - SCENARIO 4.3 - Azure firewall
- 4.5 - SCENARIO 5 - Connection Dropped
- 4.1 - SCENARIO 1 - Success path
0 - Scoping
Before we can even start thing about a connection or disconnection issue we need to better understand the scenario and we need to explore the following questions:
1. Which tool is being utilized?
2. Is the client machine situated on an Azure VM or an on-premises machine?
3. What type of firewall is in use: Azure Firewall or a third-party application?
4. What is the operating system of the host machine for the client?
5. Is the connection type private or public (Using Private endpoints)?
6. What type of user is the customer employing (SQL User, AAD User)?
7. Are connection retry policies in place?
- Retry logic for transient errors
- IMPORTANT: Transient failure are a normal occurrence and should be expected from time to time. They can occur for many reasons such as balance and deployments in the region your server is in, network issues. A transient failure can takes some seconds or minutes, when this takes more time we can look to see if there was a larger underlying reason.
8. What is the timeout value set for the connection?
9. Are you using OLEDB, ODBC, JDBC, other? Neglecting to use the latest version can sometimes lead to disconnections.
1 - How to CAPTURE a network trace
First we need to know how to start a capture and what tools to use. The tool selection depend on your personal taste and the OS being used. Remember that "The best tool is always the one you know".
First will explain my preferred, Wireshark. It is a free tool that work on multiple platforms what makes easy to support different kind of clients.
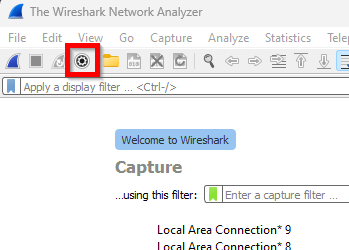
When you open it, you could just start collecting the trace. My suggestion is always start with the "config data capture settings" button.
1.1 - Input
First you need to select the network cards that will be monitored. The selection of network cards is just the blue or white rows that you select with shift and/or control commands, as you can see on image above.
- Notice in this interface there are some checkboxes (Promiscuous Mode), ignore them. They are not selection box, you can actually unselect them.
- IMPORTANT: If you select default (first card) you may not collect anything useful. Make sure you select the correct interface. Or just select all if not sure
1.1.1 - Capture filter
In the bottom you can also filter the capture, ideally you should not filter, but if need to save resources / space in disk might be useful, so you capture traffic only of specific ports and IP addresses. You can add as sample
- SQL port 1433 + 11xxx range needed for redirect + 53 for DNS requests
tcp portrange 11000-12000 or tcp port 1433 or tcp port 53
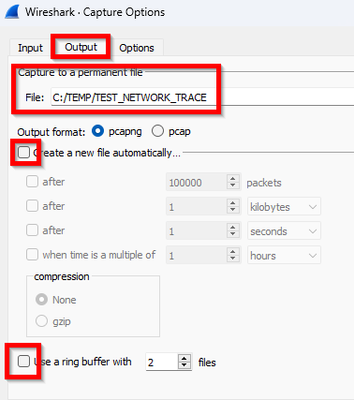
1.2 - Output
This output area will depend if you can easily repro the issue, or if it is more like a transient issue.
1.2.1 - Reproducible error?
If the error you are facing is repeatable, you can capture one single file, repro the issue and stop data collection, like sample below
1.2.2 - Transient error?
If the error is intermittent, you might need to caputure what we call a CIRCULAR network trace capture. That means that trace will be capturing in a loop until you stop the data collection, it will keep as many files of the specified size you define.
Check some important information below:
- Do NOT create files over 2GB, will be a problem to open it, instead, increase number of files. Just need more disk
- As soon as error happens, try to stop collection or else you might lose telemetry, you can also increase number of files to keep more data
- It is hard to estimate how much time each 2GB file can handle. It will depend on volume of data you are sending
1.3 - Options
The last part you could create some stop condition like stop after some time. Keep default options here
Then just click to start collection
2 - Capture Alternatives
Before we start analyzing it, we need to talk about alternatives
-
2.1 - NETSH - Native on Windows.
- No need to install new tool on environment
- ETL file output does not open on Wireshark nativelly, you need to convert it. Can use application (https://github.com/microsoft/etl2pcapng)
-
NETSH Short capture
- Only 1 file of 2GB
- Start CMD (Run as Admin)
- Start the process:
-
netsh trace start persistent=yes capture=yes tracefile=%temp%\%computername%_nettrace.etl maxsize=2048
-
- Reproduce the issue.
- Stop the process:
-
netsh trace stop
-
-
NETSH Circular capture
- Only 1 file of 2GB you can get more data truncating packages (packettruncatebytes=512)
- Start CMD (Run as Admin)
- Start the process:
-
netsh trace start capture=yes packettruncatebytes=512 tracefile=%temp%\%computername%_nettrace.etl maxsize=2048 filemode=circular overwrite=yes report=no
-
- Reproduce the issue.
- Stop the process:
-
netsh trace stop
-
-
2.2 - TCPDUMP - Native on Linux / MacOs
-
TCPDUMP Short capture
-
tcpdump -n -w /var/tmp/traffic.pcap
-
- TCPDUMP Circular capture
- 10 files of 2GB
-
tcpdump -n -w /var/tmp/trace.pcap -W 10 -C 2000
- TCPDUMP permission
- If needed can also run with sudo
-
SUDO tcpdump -n -w /var/tmp/traffic.pcap
-
TCPDUMP Filter interface
- For linux servers, you can use "netstat -i" to list the available INTERFACE devices as well.
-
sudo netstat -i
- Kernel Interface table
Iface MTU ........
eth0 9001 ........ -
tcpdump -i eth0 -n -w /var/tmp/traffic.pcap
- References
- https://www.tcpdump.org/
- https://www.tcpdump.org/manpages/tcpdump.1.html
- https://superuser.com/questions/904786/tcpdump-rotate-capture-files-using-g-w-and-c
- https://community.boomi.com/s/article/How-To-Capture-TCP-Traffic-Continuously-For-Intermittent-Issues
- https://developer.apple.com/documentation/network/recording_a_packet_trace
-
3 - Tool configuration - Wireshark
Now that capture is done, we can start looking into the capture, just need to set something on Wireshark to make sure that the interface is ready to analyze and is showing the information needed to analyse it.
-
Date time format to UTC
- Make sure to set date time format correct, so this way won't exist confusion with timezone (from server side, client side vs client machine timezone). Use UTC
-
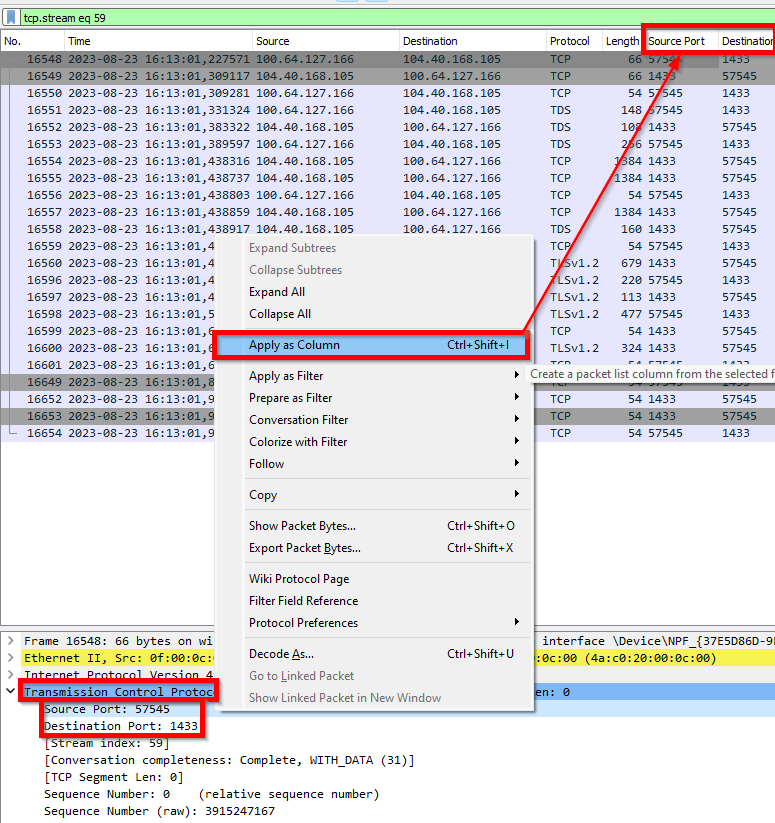
Source and destination ports
- Source and Destination IP might not be enough. To simplify analysis, add also source and destination ports as columns.
- In the package (below), look for the Transmission Control Protocol (TCP) and get Source and Destination ports. Add them as columns. Like image below
4 - Analysis
With the file captured you will use display filters that will depend on the error that you are looking for. The most common used are below
- Get SQL Comunication + DNS resolution
-
(tcp.port in {1433, 11000..11999} or (dns.qry.name contains "database.windows.net") or (dns.qry.name contains "sql.azuresynapse.net"))
-
- Look for SQL connections that were reseted (Disconnection scenarios)
-
(tcp.port in {1433, 11000..11999}) and (tcp.flags.reset == 1)
-
Find below some scenarios that will help you get some ideas:
4.1 - SCENARIO 1 - Success path
Let's firs understand the success path. What is expected on a success connection
Ref to Mermaid script used to create above diagram if you want to reuse this on different context
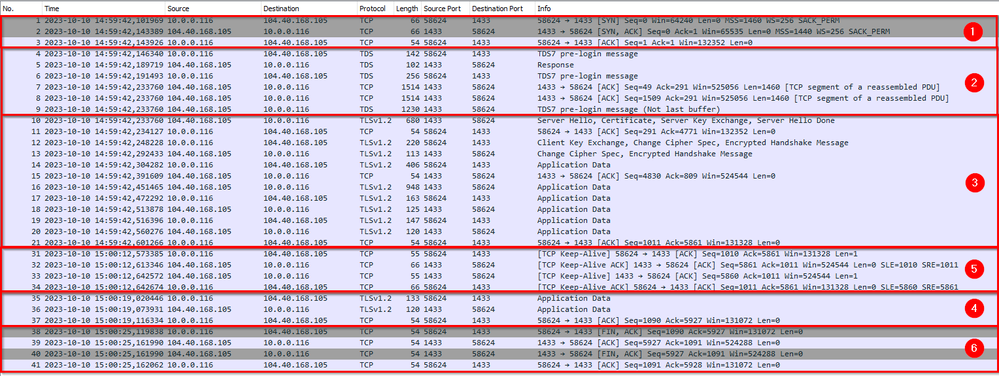
- TCP Handshake: This is the first step when a client (for example, your computer) wants to establish a connection with a server (like Synapse). It involves three steps (three-way handshake)
- The client sends a SYN (synchronize) packet to the server.
- The server acknowledges this by sending back a SYN-ACK (synchronize-acknowledge) packet.
- Finally, the client sends an ACK (acknowledge) packet back to the server.
- Now, the connection is established and ready for data transfer.
- Prelogin to Synapse: When connecting to Synapse or Azure SQL DB, there’s a pre-login handshake that happens. This is where the client and server agree on certain settings for the connection. If this handshake fails in the middle, you might see pre-login handshake errors as connection to gateway completed, but not able to complete login process.
- Key Exchange: After the pre-login handshake, there’s a key exchange process. This is where the client and server agree on a secret key that they’ll use for encrypting and decrypting the data they send to each other. This involves exchanging random numbers and a special number called the Pre-Master Secret . These numbers are combined with additional data permitting client and server to create their shared secret, called the Master Secret. The Master Secret is used by client and server to generate the session keys used for hashing and encryption. Once the session keys are established, the client sends a “Change cipher spec” notification to server to indicate that it will start using the new session keys for hashing and encrypting messages
- Data Transfer: Now, client and server can exchange application data over the secured channel they have established.
- Idle connection / Keep Alive: Sometimes, a connection between two devices might be open, but no data is being sent. This could be because the user is not performing any action that requires data to be sent or received like a SQL Update command.
Now, if one device doesn’t hear from the other for a long time, it might think that the connection has been lost. To prevent this from happening, devices send small packets called “Keep-Alive” packets. These packets are like a small nudge or a ping saying “Hey, I’m still here!”. They help in maintaining the connection alive even when no actual data is being transferred. Idle connections that keeps for long time (30 min) can still be disconnected
- Microsoft DOC
- https://learn.microsoft.com/en-us/troubleshoot/azure/synapse-analytics/dedicated-sql/dsql-conn-dropped-connections#connection-policy-configuration-for-gateway-issues
- "The Azure SQL Database gateway terminates sessions that are idle for more than 30 minutes. This scenario frequently affects pooled, idle connections. For dedicated SQL pool (formerly SQL DW), you can switch the connection policy for your server from proxy to redirect. The redirect setting bypasses the gateway after it's connected. This eliminates the issue."
- Check also post from @hugo_sql
- Microsoft DOC
-
Finish with success: The FIN flag in a TCP packet stands for FINish. It is used to indicate that the sender has finished sending data and wants to terminate the TCP connection. This process is known as the four-way handshake and is used to gracefully terminate a TCP connection. It ensures that both sides have received all the data before the connection is closed
Here’s a simple explanation of how it works:
-
When an application is done sending data, it sends a TCP packet with the FIN flag set.
-
The receiving side acknowledges this by sending back a packet with an ACK (acknowledgement) flag.
-
The receiver then sends its own FIN packet when it’s done sending data.
-
Finally, the original sender acknowledges this with another ACK.
Finish without success: In a network, when a device sends a TCP packet to another device, it expects an acknowledgement in return. However, there might be situations where the receiving device cannot process the packet properly or the connection is not valid anymore. In such cases, the receiving device sends a TCP packet with the Reset (RST) flag set. The RST packet is like a message saying “I can’t process this, let’s terminate this connection”. It’s a way for a device to signal that something has gone wrong in the communication process. Even though a reset coming from Server to client does not mean server is down. It could be dropped because of some security reason like taking long time in the login process. Check more info later on scenarios
Here are some reasons why an RST packet might be sent:
- The receiving device was restarted and forgot about the connection.
- The packet was sent to a closed port.
- The packet was unexpected or not recognized by the receiving device.
-
Additional ref:
- https://learn.microsoft.com/en-us/windows/win32/secauthn/tls-handshake-protocol
- https://learn.microsoft.com/en-us/troubleshoot/windows-server/networking/three-way-handshake-via-tcpip
- https://en.wikipedia.org/wiki/Transmission_Control_Protocol
- https://cabulous.medium.com/tcp-3-way-handshake-and-how-it-works-8c5f8d6ea11b
- https://learn.microsoft.com/en-us/sql/connect/jdbc/connection-resiliency
4.1.1 - Simple sample on Wireshark
And here we can see a real communication on Wireshark transfer. The numbers on the right match with explanation above
It was a simple SQLCMD command with a wait of 30 seconds before executing the command so we could see a keep alive package also
PS C:> sqlcmd -S Servername.sql.azuresynapse.net -d master -U ******** -P ********
1> select 1
2> go
-----------
1
(1 rows affected)
1> exit
Or could have ended in a bad way, in this scenario, forcing a RST package by killing powershell terminal, so it could not end connection properly
4.1.2 - Direction of the packages
One important thing to notice here is the direction of the packages. Destination of Synapse or Azure SQL DB will always be 1433 and/or 11000-11999 in case of redirect, and source port will be a big port number, this is called ephemeral ports.
Ephemeral ports are temporary communication points used for internet connections. They’re like temporary phone numbers that your computer uses to talk to other computers on the internet.
When you visit a website or use an app, your computer will automatically pick an available ephemeral port from a specific range of numbers. This port is used for that specific connection only and once the conversation is over, the port is closed and can be reused for another connection.
The range of these ports can vary depending on your operating system. For example, many Linux systems use ports 32768-60999, while Windows systems use ports 49152-65535.
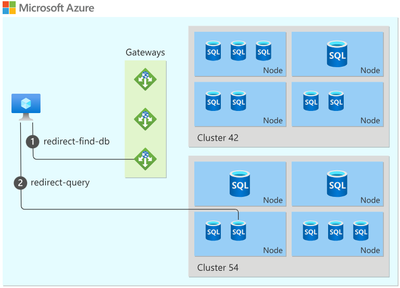
4.1.3 - Redirect
For more information on Proxy vs Redirect check Part 1 - Inbound SQL DW connections on Public Endpoints, here we I just want to show this comunication from network trace point of view. And below we can see
- the Source / Destination ports = 1433 means you are speaking with Synapse Gateway,
- when you see port 11xxx range means you are using redirect, that means that you are comunicating directly with host server (Called Tenant Ring)
To better understand this scenario check doc below
Azure Synapse Analytics connectivity architecture
4.2 - SCENARIO 2 - The server was not found or was not accessible
Let's imagine you are looking for simple error
===================================
Cannot connect to WRONGSERVENAME.sql.azuresynapse.net.
===================================
A network-related or instance-specific error occurred while establishing a connection to SQL Server.
The server was not found or was not accessible. Verify that the instance name is correct and
that SQL Server is configured to allow remote connections.
(provider: Named Pipes Provider, error: 40 - Could not open a connection to SQL Server)
(Framework Microsoft SqlClient Data Provider)
For "Server not found" error you should be looking for Part 1 - Inbound SQL DW connections on Public Endpoints and Part 2 - Inbound Synapse Private Endpoints of my blog posts series. You can easily check it with NSLOOKUP command. There is NO need to capture network trace in this kind of error. But anyway to show the network trace troubleshooting, I used the display filters below, That can be used to filter Synapse connection related
(tcp.port in {1433, 11000..11999} or (dns.qry.name contains "database.windows.net") or (dns.qry.name contains "sql.azuresynapse.net"))
TIP: If you are NOT seeing DNS requests may be because you already have them on cache. Try to clear it before capturing
ipconfig /flushdns
In the sample above We can see that I sent requests to my 2 DNS servers (Using google DNS servers) and for both I got same answer back from DNS saying "No such name A XXXXXXXX" that mean that this server does not exists.
If the name was correct, then you could have a DNS problem. This is a common issue when using Private Endpoints. Check Part 2 - Inbound Synapse Private Endpoints of these blog posts series as mentioned above
Another common issue for same error message could be port is closed. Best option is to use a Azure Synapse Connectivity Checker. This script helps us verify various aspects. Follow the instructions on Git Main Page to execute script. Upon executing the script, you can check if you have name resolution working fine and all needed ports open, illustrated in the sample below:
PORTS OPEN (Used CX DNS or Host File entry listed above)
- TESTS FOR ENDPOINT - XXX.sql.azuresynapse.net - CX DNS IP (XXXXX)
- PORT 1433 - RESULT: CLOSED
- PORT 1443 - RESULT: CLOSED
- PORT 443 - RESULT: CONNECTED
- TESTS FOR ENDPOINT - XXX.sql.azuresynapse.net - CX DNS IP (XXXXX)
- PORT 1433 - RESULT: CLOSED
- PORT 1443 - RESULT: CLOSED
- PORT 443 - RESULT: CONNECTED
- TESTS FOR ENDPOINT - XXX.database.windows.net - CX DNS IP (XXXXX)
- PORT 1433 - RESULT: CLOSED
- PORT 1443 - RESULT: CLOSED
- PORT 443 - RESULT: CONNECTED
- TESTS FOR ENDPOINT - XXX.dev.azuresynapse.net - CX DNS IP (XXXXX )
- PORT 443 - RESULT: CONNECTED
After analyzing the information provided above, we observed that port 1433 is closed. This port is essential for establishing connections from Power BI, SSMS other clients.
If your issues is from Synapse Studio make sure to check 443 and 1443 as documented at https://learn.microsoft.com/en-us/azure/synapse-analytics/security/synapse-workspace-ip-firewall#connect-to-azure-synapse-from-your-own-network
4.3 - SCENARIO 3 - Redirect port 11xxx range closed
Another similar error to above, but with different conclusion. The customer had a Synapse workspace with public network access enabled and was attempting to connect to the SQL endpoint using SSMS. However, they were unable to complete the login process due to the error below:
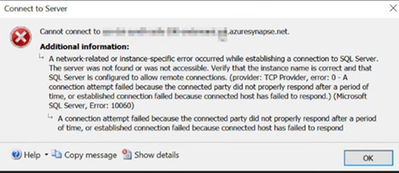
Cannot Connect to Server.sql.azuresynapse.net
A network-related or instance-specific error occurred while establishing a connection to SQL Server. The server was not found or was not accessible. Verify that the instance name is correct and that SQL Server is configured to allow remote connections. (provider: TCP Provider, error: D - A connection attempt failed because the connected party did not properly respond after a period of time, or established connection failed because connected host has failed to respond.) (Microsoft SQL server, Error: 10060)
Troubleshooting
If we do the NSLOOKUP and test port command as suggested above we could see that connection to gateway was OK. Looking further on network trace using filter similar as above
(tcp.port in {1433, 11000..11999} or (dns.qry.name contains "database.windows.net") or (dns.qry.name contains "sql.azuresynapse.net"))
In the following example, the traffic indicates that communication TO the redirect port (11008) was unsuccessful. Client is trying to stabilish a TCP connection (SYN / SYN-ACK / ACK) but there is no reply back.
Solution
The customer should enable outbound communication on CX side firewall from the client to ALL Azure SQL IP addresses within the region on ports within the range of 11000 to 11999 when using public endpoint and using redirect mode. Utilizing the Service Tags for SQL can simplify the management of this process.
- https://learn.microsoft.com/en-us/azure/azure-sql/database/connectivity-architecture?view=azuresql#connection-policy
- https://learn.microsoft.com/en-us/azure/virtual-network/service-tags-overview#service-tags-on-premises
4.4 - SCENARIO 4 - Connection timeout (Middle connection) / PreLogin handshake
Here are some samples of error messages you might receive:
- Connection Timeout Expired. The timeout period elapsed while attempting to consume the pre-login handshake acknowledgement. This could be because the pre-login handshake failed or the server was unable to respond back in time. The duration spent while attempting to connect to this server was - [Pre-Login] initialization=5895; handshake=29;
- A connection was successfully established with the server, but then an error occurred during the pre-login handshake. (provider: TCP Provider, error: 0 - The semaphore timeout period has expired.)
- A connection was successfully established with the server, but then an error occurred during the login process
- Failed to copy to SQL Data Warehouse from blob storage. A connection was successfully established with the server, but then an error occurred during the login process. (provider: SSL Provider, error: 0 - An existing connection was forcibly closed by the remote host.) An existing connection was forcibly closed by the remote host
This error means that client WAS able to reach Synapse gateway, or else I would get "Server not found" error as mentioned above, but I still could not complete the connection
This usually indicate some issue on network level. Below you can find some related scenarios for above issue:
4.4.1 - SCENARIO 4.1 - TLS Blocked
Something that we see eventually in a customer is where we see TCP communication is OK, so PORT IS OPEN. If you do simple test, port looks open. But encrypted messages TDS / TLS does not get through. From cliente point of view you have pre-login timeout because you reach server, but the connection was not able to complete the login.
In this scenario you need to check client network team need to review firewall configuration. For real CX scenario, their company firewall was blocking this comunication
Here is a sample
4.4.2 - SCENARIO 4.2 - Long connection
Another possible scenario is when client machine have some issues like as sample high CPU for long time and delaying package receive / send. We have an internal security measure that if a connection is taking long time, we might eventually disconnect you. From client point of view, this is a pre-login handshake failure.
In this scenario is not Server fault, it was just client with CPU so HIGH, that cannot handle network packages fast enough. And after long time Synapse will disconnect this connection because it did not complete in the expected time.
4.4.3 - SCENARIO 4.3 - Azure firewall
In this other scenario the customer had a Synapse workspace with public network access and attempted to connect to the Dedicated SQL pool using SSMS through an Azure VM. However, they were unable to complete the login process due to the error below:
Cannot connect to Server.sql.azuresynapse.net.
A was successfully established with the server, but then an error occurred during the login process. (provider: SSL Provider, error: 0 - An existing connection was forcibly closed by the remote host.) (Microsoft 10054)
An existing connection was forcibly closed by the remote host
Troubleshooting
The error indicates that the connection has been successfully established, but the login process was not completed. Therefore, the ports are open. However, now we need to check the communication traffic by capturing the network trace.
Now, let's have a look at the trace below. We will note the FIN packages (Explanation of FIN packages, check above) coming from port 1433 to the destination port 63417. The communication starts at 10:38.42, and the FIN occurred at the same time as start. Something in the middle is breaking communication.
After some troubleshooting, we noted that there was an Azure Firewall that was part o CX network. Therefore, the flow of communication will be as follows:
- VM Machine ---> Azure FW ---> Synapse workspace.
Solution
In this scenario we involved Azure Firewall support team that explained the following:
Azure Firewall supports rules and rule collections. A rule collection is a set of rules that share the same order and priority. Rule collections are executed in order of their priority. Network rule collections are higher priority than application rule collections, and all rules are terminating.
There are three types of rule collections:
- Application rules: Configure fully qualified domain names (FQDNs) that can be accessed from a Virtual Network.
- Network rules: Configure rules that contain source addresses, protocols, destination ports, and destination addresses.
- NAT rules: Configure DNAT rules to allow incoming Internet connections.
Ref: https://learn.microsoft.com/en-us/azure/firewall/firewall-faq#what-are-some-azure-firewall-concepts
Accordingly, If networking rules and application rules have been configured, network rules are applied in priority order before application rules.
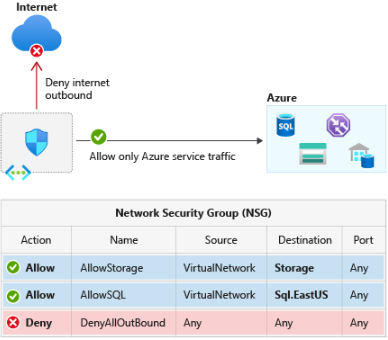
In this scenario cx had an Application rule to allow client to reach FQDN (server.sql.azuresynapse.net), this rule would not work for redirect that was scenario here. It was recommended to create a Networking Rule, to allow 1433 port + range of redirect ports (11000-11999) using Service tags. The Service tags are found under Networking Rules, and we need to configure the Firewall Policy to allow these communications.
After allowing this communication, the login process has been completed.
4.5 - SCENARIO 5 - Connection Dropped
Let's suppose that the customer is loading data using ETL tools such as SSMS, ADF, Synapse ADF, Databricks, or any other third-party tool. This loading process has failed due to a disconnection. However, this disconnect does not occur in a predefined manner but happens in a transient way, making it challenging to identify or figure out how to reproduce the issue or determine the exact cause behind this problem.
As long as the data loading process proceeds smoothly, there is no need to conduct connectivity tests since the connection is initially established (that means WE CAN CONNECT) but it's subsequently interrupted. But it is essential to gain insights into how the connection is established and the location of the client machine.
Troubleshooting
Troubleshooting begins with the collection of network traces in a circular manner (As explained above). The network trace collection remains active until the issue occurs, at which point the customer needs to stop the trace, as soon as possible.
Within the network trace, we focus on the communication occurring between the Synapse database and the client machine. When dealing with disconnection issues, it's crucial to examine the RESET packages (RST) in the network trace, as outlined below:
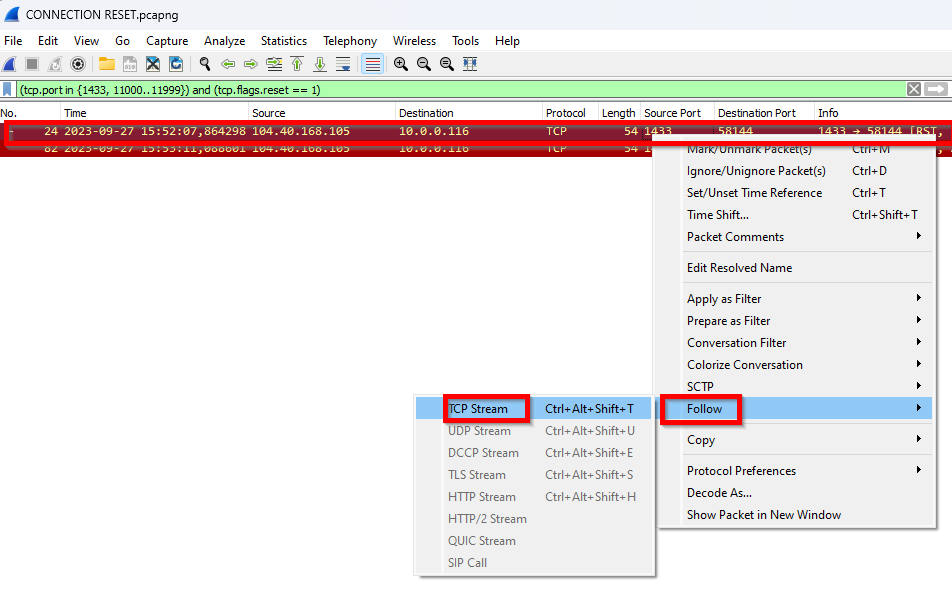
To use reset Filters , please use this
(tcp.port in {1433, 11000..11999}) and (tcp.flags.reset == 1)
Notice that in these scenarios the RESET is coming from SERVER to CLIENT (1433 -> Ephemeral Ports).
Even though it came from server, we might need additional investigation on why SERVER sent a reset. That does not mean a health issue on server. It could be a connection reset because you did a scale up operation and this will cause all existing connections to be dropped.
To better understand what happened before the connection dropped you can follow up connection
As data is encrypted there is not much to see on below screen. You can just close
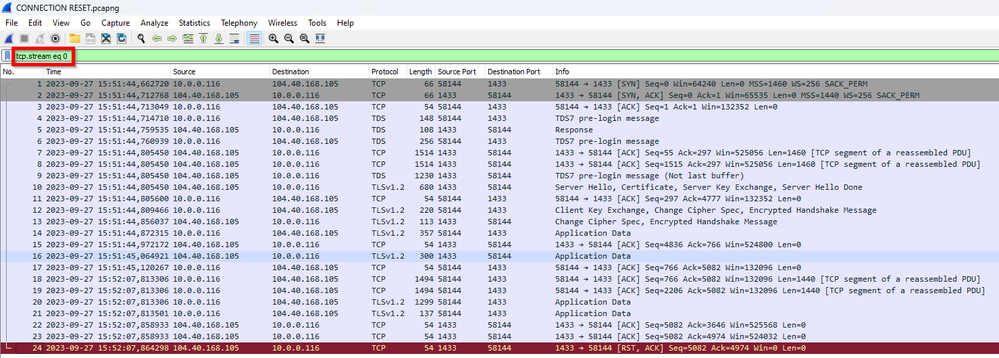
Now the trace will be filtered with just one single communication thread using filter by tcp.stream.
In this sample we can see that connection completed and eventually you got connection reseted by Server side (1433 -> Ephemeral port)
With this time you can try to investigate for some issue that happened at same time that could explain the disconnection or you can also open a case for further investigation sharing this network trace.
Another sample
I run a command that is not actually moving data back and forth
WAITFOR DELAY '01:00:00'
This could be similar to an update that takes a long time on server side, but during all query duration it will not need to send data to client side… To avoid keeping this connection idle Client or Server need to keep sending Keep-Alive packages, and other side need to send ACK to make sure that the other side will keep connection alive.
This keep-alive packages does not mean any error !!! (Check detailed explanation above)
It just mean that during some time there was no comunication between client and server. If idle for long time you can be disconnected
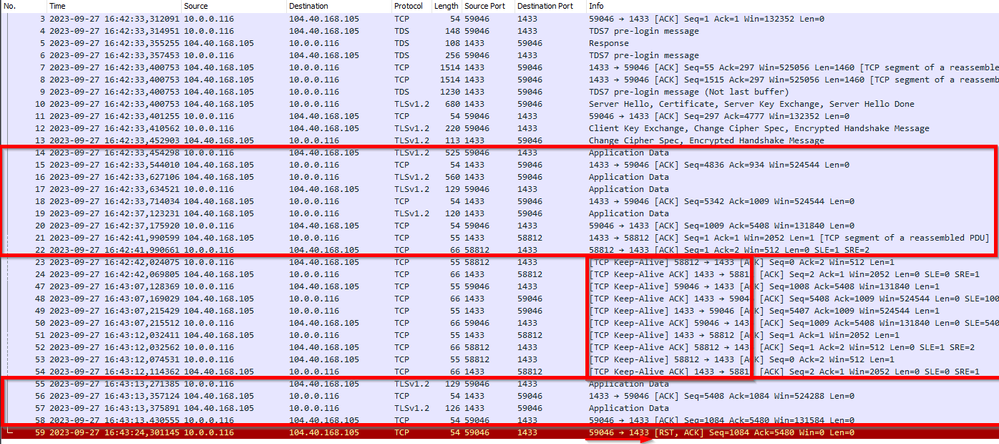
In this sample below we can see:
• Client and server exchange some data
• Client stop requesting and at network level we can see some keep alive packages
• Some more data exchange
• Client is forced to close (In this case forced killing the application). Connection reset is sent from client to server to notify server that this client is gone
Summary
Hope this guide is useful to increase your knowledge on how connection behind the scene and how can you go deep into troubleshooting network traces
More info at: Troubleshoot connectivity issues on a dedicated SQL pool
Published on:
Learn more


