
Use Azure Maps to calculate an isochrone to reach your customers

Imagine you are a store owner and would like to target customers that live within a 15-minute drive from your store with advertising for your weekly specials. You could draw a circle on a map, guessing that is about 15 minutes away, but it will not truly represent the time it will take for customers to get to your store. For example, a customer living near a major transit route can live further away from the store than a customer living in a less well-served part of the city. To meet this need, an isochrone is a polygon (an area on a map) of expected travel time. It represents the locations that will take the specified time, or less, it will take to get to a specific point (your store, in this case). Estimating an isochrone correctly, including all the variables like traffic, road, and vehicle conditions, is very hard to do by yourself!
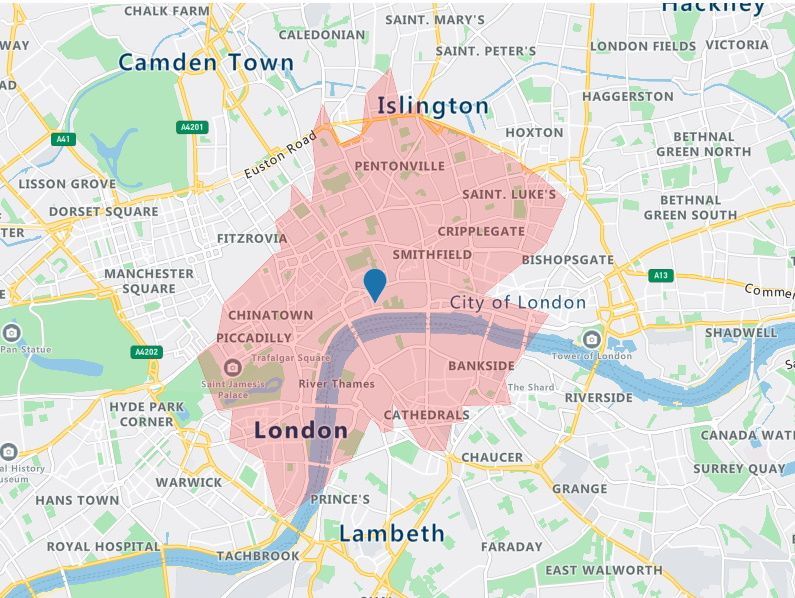
Azure Maps Get Route Range
Using the Get Route Range API from Azure Maps makes it very easy to calculate the isochrone. For our store example, we need to calculate a 15-minute isochrone for every store we have. We only need the coordinates (longitude and latitude) from our stores and the drivetime in seconds (15 x 60 = 900 sec).
GET https://atlas.microsoft.com/route/range/json?subscription-key=[subscription-key]&api-version=1.0&query=47.65431,-122.1291891&timeBudgetInSec=900Search Customer Address
To determine which customer is living inside the 15-minute drive isochrone, we first need the coordinates for every customer’s address. Then, we simply loop through all our customers and use the Get Search Address API to get the coordinates.
GET https://atlas.microsoft.com/search/address/json?subscription-key=[subscription-key]&api-version=1.0&query=15127 NE 24th Street, Redmond, WA 98052Point In Polygon
The last step is to check if a customer coordinate is inside one of our store isochrones. We use the Point In Polygon API to determine if this is true.
POST https://atlas.microsoft.com/spatial/pointInPolygon/json?subscription-key=[subscription-key]&api-version=1.0&lat=33.5362475&lon=-111.9267386And in the request body the store isochrone.
We now can target those customers with store-specific offers and promotions.

Examples
What schools are within a 20-minute walk from my home? What available jobs are within a 30-minute transit commute? Where you are located and what is near you brings context to the choice of where you want to live and Azure Maps Isochrone API can help you bring that location intelligence into your applications.
- Azure Maps Isochrone Samples
- Best practices for Azure Maps Search Service
- Search for a location using Azure Maps Search services
Published on:
Learn moreRelated posts
Introducing the Data-Bound Reference Layer in Azure Maps Visual for Power BI
Imagine managing a nationwide sales team and needing to understand how your sales align with factors like population density, competitor locat...
Enhance Azure Maps with Overture Maps Data using PMTiles!
Supercharge Azure Maps with Overture Maps Data using PMTiles! We’ve got some exciting news. Azure Maps now supports PMTiles! This me...
Where do I go if I have questions about Azure Maps?
As you might expect, just looking around on your own, or asking Co-pilot, you can find comprehensive help like Samples.AzureMaps.com, wit...
Tailor your Reference Layers in Azure Maps Visual for Power BI
We’re excited to share the latest enhancements to the Azure Maps visual in Power BI, designed to make your data visualization even mor...
Enhancing Logistics with Azure Maps and NVIDIA cuOpt for Multi-Itinerary Optimization
The logistics industry is always finding ways to optimize vehicle routing to enhance efficiency. The Vehicle Routing Problem (VRP) and Pickup ...
Introducing the Unified Azure Maps Experience
Microsoft has recently announced the unification of Bing Maps for Enterprise (BME) with Azure Maps, marking a remarkable advancement in their ...
Power BI Azure Maps Visual: Enhanced Reference Layer & Embedded Support
The Power BI Azure Maps visual has received a major update which includes an expansion of the reference layer and the addition of Power BI Emb...
Enhance your indoor maps with real-time map feature styling
The ability to dynamically update and visualize the state of rooms or areas within a building is critical to understanding the status of any b...
Dynamic Clustering Aggregation with Custom Styling in Bubble Layer
The Power BI Azure Maps visual allows you to create stunning geospatial visualizations with your data. Today, we are excited to announce a new...
HO HO HO Two Point OH!
You might notice some big changes have come to the North Pole experience at NORADSanta.ORG this year. Developer elves have implemented a...