
There is a New Style of maps across Microsoft
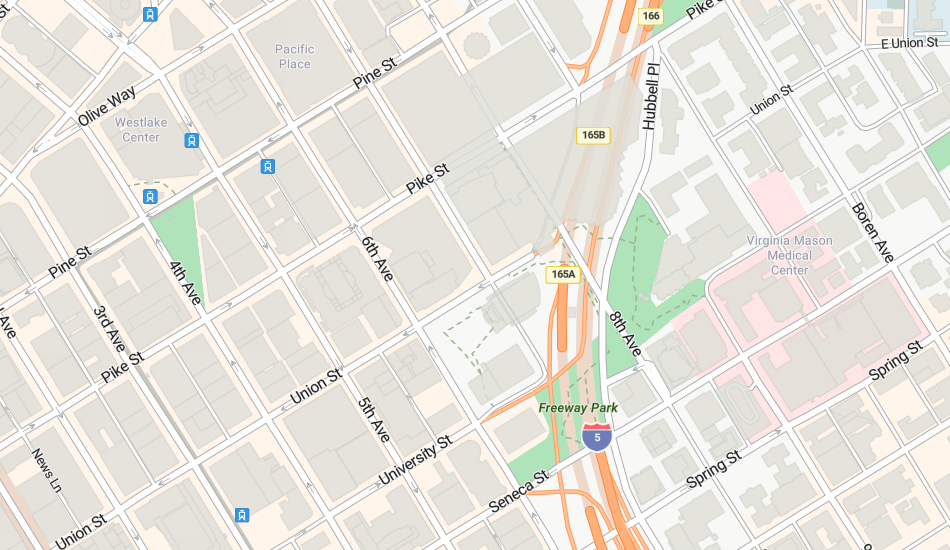
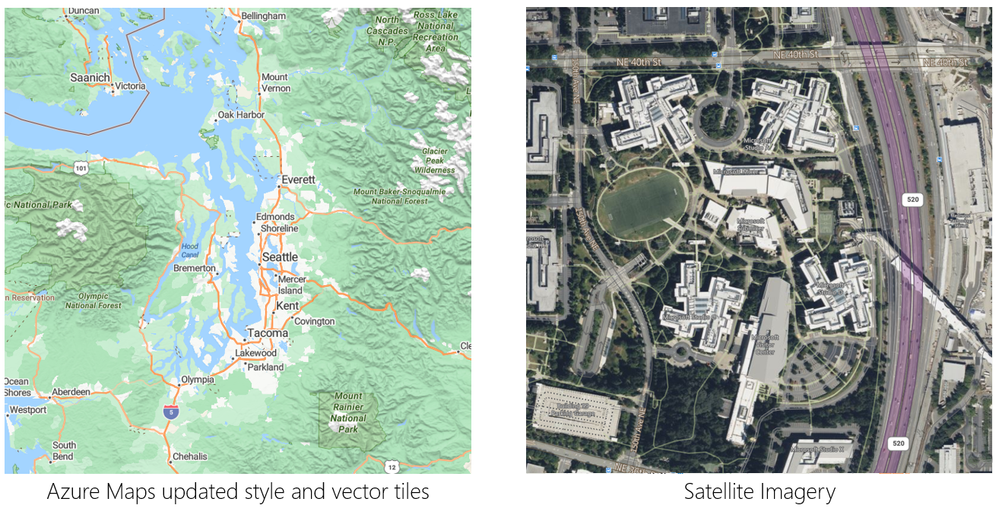
We are pleased to announce that we have developed a new and improved style for our maps across Microsoft. Azure Maps now uses the very same vector tiles and satellite imagery directly as our other Microsoft mapping platforms, which includes our Bing Maps consumer site and more. This updated style introduces a new cartographic identity across Microsoft that focuses on improving usability, information clarity, and aesthetic appeal.
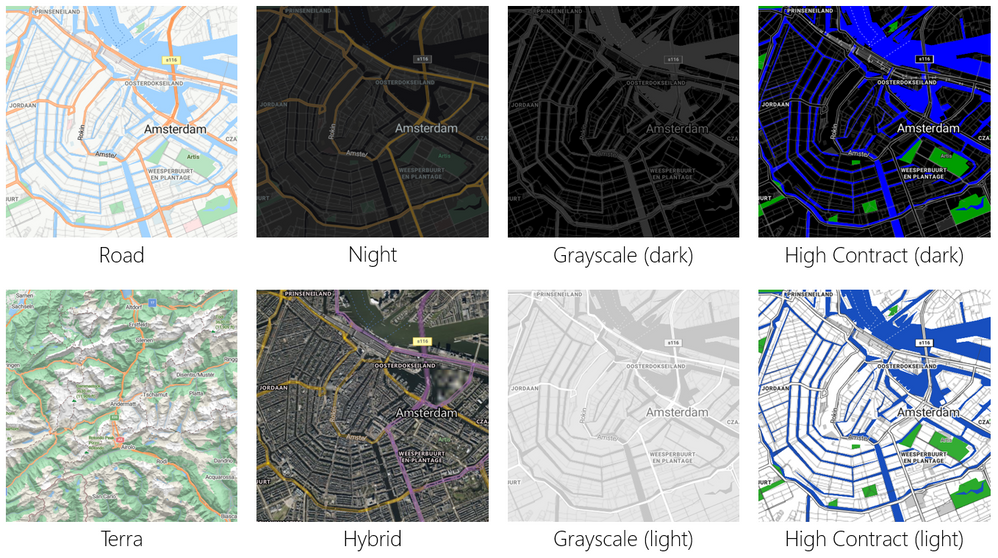
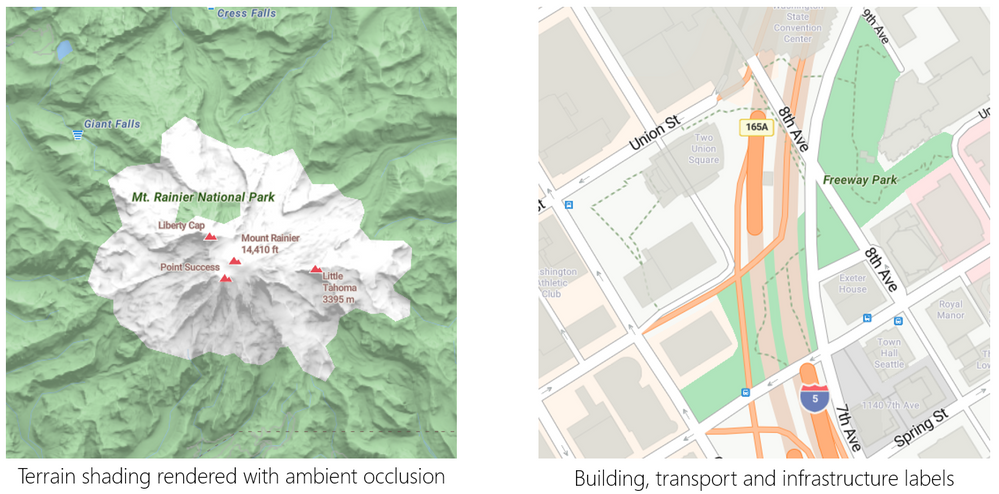
As before, Azure Maps lets you and your customers choose from several styles, such as Road, Night, Hybrid, Grayscale (dark and light), Terra, and High Contrast (dark and light). We have taken the feedback on our previous styles, and the result consists of fine-tuned colors and information density designed to make our maps more easily consumable across zoom levels and device profiles. We have also introduced transport features, with hairline rendering, to provide more information and context sooner but without impacting readability. We are going even greener as our base map colors now support biomes and landcover classes, including subtle but functional terrain shading rendered with ambient occlusion.
With this update, we have significantly improved label density to provide an even and consistent level of detail across zoom levels and geographies. We also have defined a clear hierarchy of types, making it easy to distinguish between transport and infrastructure labels versus those for administrative districts and natural features.
Another benefit comes from our partners. The Microsoft mapping platform combines and enhances data from various sources, and as a result, we have expanded our coverage in China, Japan, and Korea.
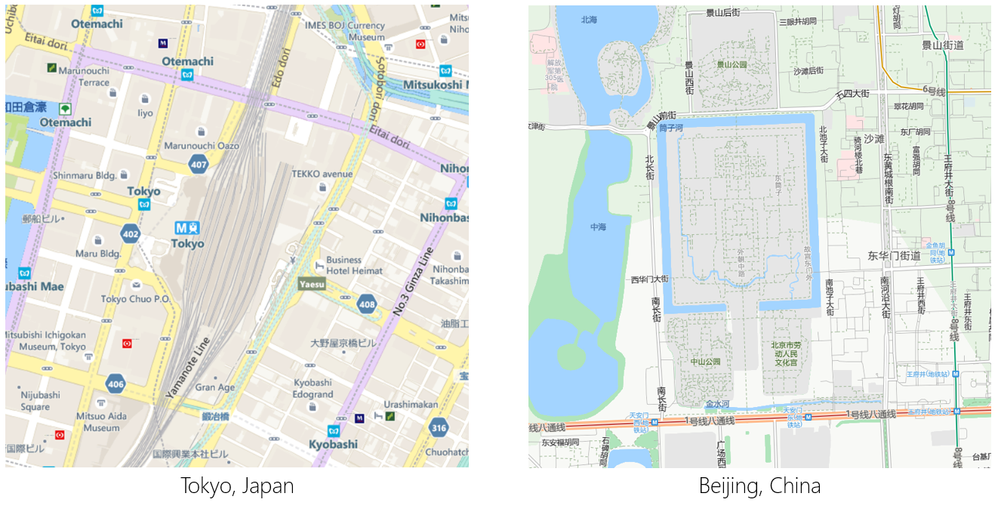
Other enhancements include additional road details, building footprints, hiking trail coverage, wider zoom level ranges for the Terra style, more transit types and information (e.g., ferry stops, metro stops, bus stops), and additional details about mountains, altitude, and waterfall locations.
We will roll out the new style more broadly over the coming weeks. If you want to explore the new style immediately, visit our Azure Maps Samples or try out the Azure Maps Demo site. You can also use the Azure Maps V3 Web Control preview version in your non-production application by using our CDN endpoint or the NPM package.
We welcome any feedback or comments you may have, which you can provide on our feedback site or in this blog.
Published on:
Learn moreWe can help you with There is a New Style of maps across Microsoft
If you want help implementing, troubleshooting, or improving this product, contact us and we’ll point you in the right direction.
Related posts
Introducing the Data-Bound Reference Layer in Azure Maps Visual for Power BI
Imagine managing a nationwide sales team and needing to understand how your sales align with factors like population density, competitor locat...
Enhance Azure Maps with Overture Maps Data using PMTiles!
Supercharge Azure Maps with Overture Maps Data using PMTiles! We’ve got some exciting news. Azure Maps now supports PMTiles! This me...
Where do I go if I have questions about Azure Maps?
As you might expect, just looking around on your own, or asking Co-pilot, you can find comprehensive help like Samples.AzureMaps.com, wit...
Tailor your Reference Layers in Azure Maps Visual for Power BI
We’re excited to share the latest enhancements to the Azure Maps visual in Power BI, designed to make your data visualization even mor...
Enhancing Logistics with Azure Maps and NVIDIA cuOpt for Multi-Itinerary Optimization
The logistics industry is always finding ways to optimize vehicle routing to enhance efficiency. The Vehicle Routing Problem (VRP) and Pickup ...
Introducing the Unified Azure Maps Experience
Microsoft has recently announced the unification of Bing Maps for Enterprise (BME) with Azure Maps, marking a remarkable advancement in their ...
Power BI Azure Maps Visual: Enhanced Reference Layer & Embedded Support
The Power BI Azure Maps visual has received a major update which includes an expansion of the reference layer and the addition of Power BI Emb...
Enhance your indoor maps with real-time map feature styling
The ability to dynamically update and visualize the state of rooms or areas within a building is critical to understanding the status of any b...
Dynamic Clustering Aggregation with Custom Styling in Bubble Layer
The Power BI Azure Maps visual allows you to create stunning geospatial visualizations with your data. Today, we are excited to announce a new...
HO HO HO Two Point OH!
You might notice some big changes have come to the North Pole experience at NORADSanta.ORG this year. Developer elves have implemented a...