
Create a data solution on Azure Synapse Analytics with Snapshot Serengeti - Part 2 (Analytics)

Author(s):
Josh Ndemenge is Cloud Developer Advocate for Data at Microsoft and David Abu is a Cloud Advocate Power BI at Microsoft.
This is the second blog in a four-part series on building an end-to-end data analytics and machine learning solution on Azure Synapse Analytics. If you haven't already, be sure to check out the first blog at https://aka.ms/synapseserengeti before proceeding.
In the first blog, we covered how to create the Synapse workspace and use notebooks to load data into Azure Data Lake Gen2 and the SQL Data Warehouse. In this blog, we will explore how to integrate with Power BI and the Azure Machine Learning service.
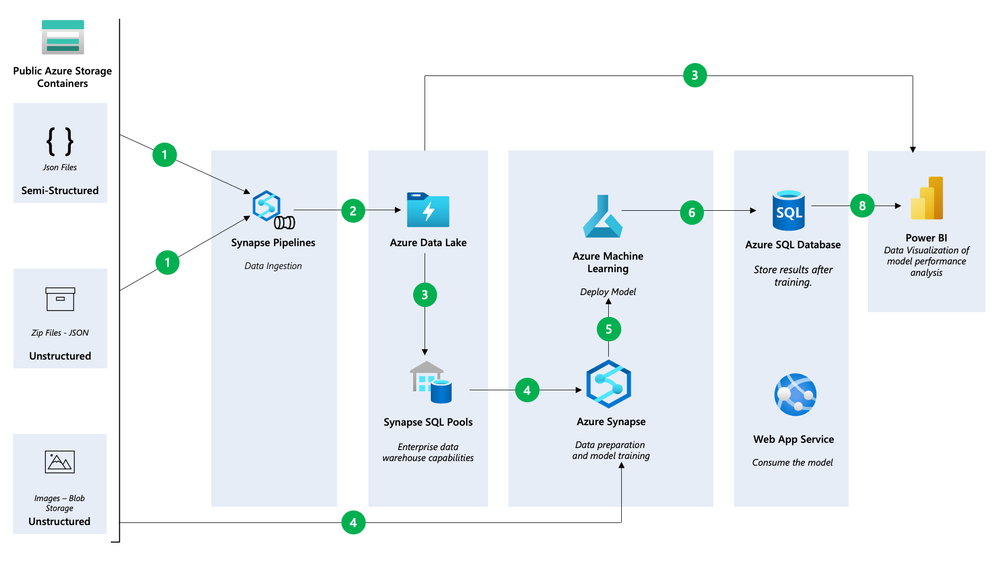
To get started, let’s connect the SQL data warehouse to Power BI and create a few reports!
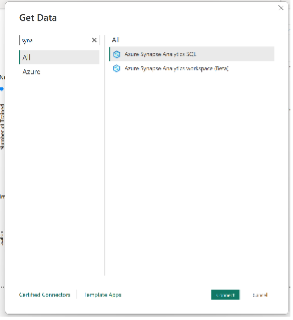
To connect to Azure Synapse Analytics using Power BI Desktop, first open the application and click on the “Get Data” button. Then, select “More” to see a wider range of data source options. In the search bar, type in “Synapse” to filter the options and select “Azure Synapse Analytics (SQL)” from the list.
Next you will be prompted to enter your server name. Type in the name of your server and then click on the “Direct Query” option.
*Note that Direct Query is a connection mode that allows you to query data directly from the data source in real-time, without the need to import it into Power BI.
On the other hand the Import mode, data is first loaded into Power BI’s internal data model before it can be queried and visualized. Check out DirectQuery in Power BI to learn more,
Click Ok and the open Power Query Editor to see the data.
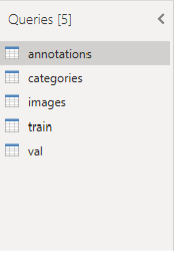
Click on the Annotations table, next on the dropdown next to Category Id uncheck 0 and 1. This is to remove the empty and human categories from the dataset.
Repeat this for the categories table, the click Close and Apply to navigate to the Power BI homepage.
Modeling data in Power BI
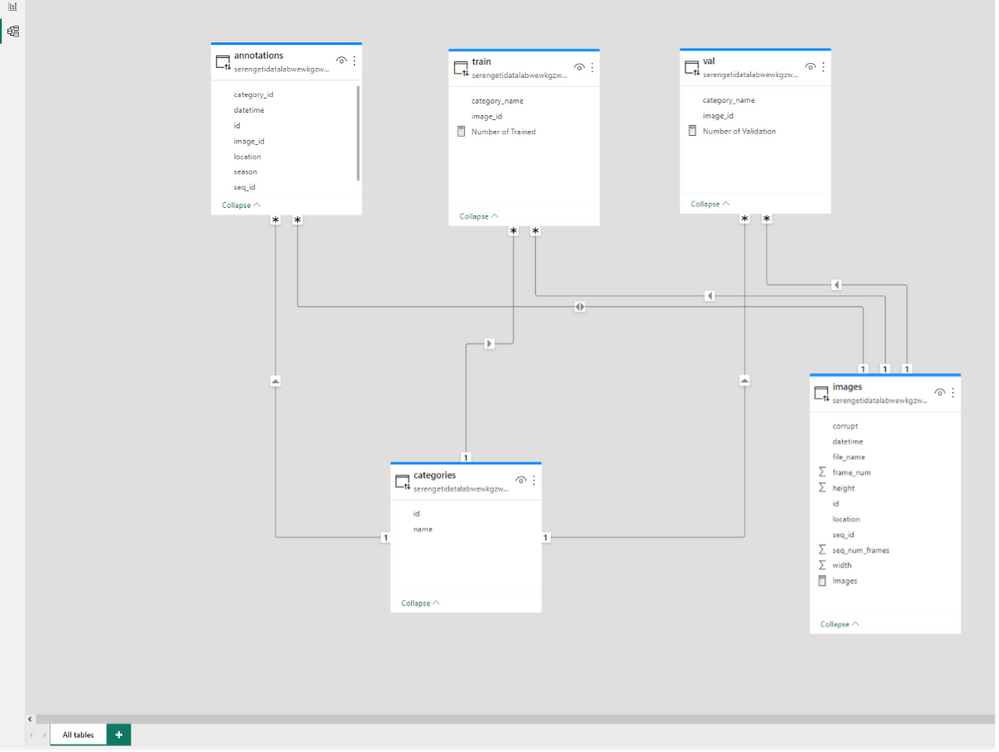
Our objective is to link the different tables within the model view to create a model link similar to the one below.
To model the data, follow these steps:
- Click Categories [id] and drag to connect to annotations[category_id]
- Click Categories [name] and drag to connect to train[category_name] and Val[category_name]
- Click images[id] and drag to connect to annotations[image_id] and in properties, make the cross-filer direction to be BOTH.

- Click images[id] and drag to connect to train[image_id] and Val[image_id]
Now we have completed the modelling of this data and we want to start analyzing the data. Click the top left report view icon to go back to the blank white canvas.
*Note: As of March 2023, the Power BI interface as changed, and you might notice during the exercise. Kindly update your Power BI desktop.
DAX measures
We will create a simple report and we will use some DAX measures to count the rows in the annotation, images, train and Val tables. To achieve this we’ll leverage the New Quick Measures AI functionality within Power BI
- Click on Quick Measure at the top.
- Click on Suggestions
- Type “count how many rows in the images table” and click Generate.
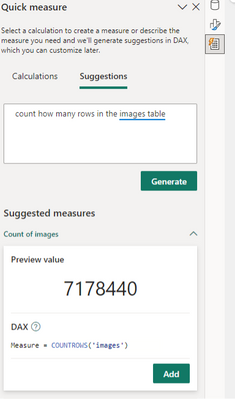
- Click Add.
- At the top bar, you can change the function name “measure” to “Number of images”.
- Create the DAX measurement for other tables using the quick measure AI tool.
- Annotation
- Train
- Val
- Change the measures to appropriate names accordingly.
Creating charts
Next, we’ll create visualizations to explore the variations in animal images from Snapshot Serengeti across different seasons, locations and species.
To learn more about on-object visual, check out Use on-object interaction with visuals in your report (preview).
1. Click a card visual, click the measure called Images to the visual
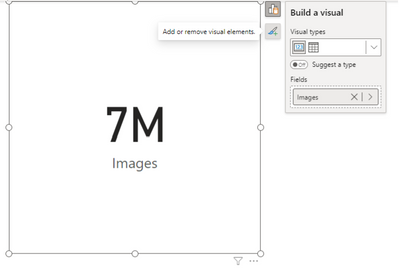
- To access the editing mode, press the + icon next to the card visual.
- Select more options from the menu.
- You can now edit and interact with the visual.
2. Add 3 card visuals to display the measures created above:
- Number of Trained
- Number of Validation
- Number of Annotation
3. Add 2 slicer visuals:
- The first one for categories[name] and rename it to Animals -The second one for Annotation[season] and rename it to Season

4. To show the Annotation count by Animals, use a clustered bar chart.
- Select the clustered bar chart option.
- On the right data pane, choose Categories[name] and Number of Annotation

5. To show the Annotation count by Season, use a clustered bar chart.
- Select the clustered bar chart option.
- On the right data pane, choose Annotation[season] and Number of Annotation
6. To show the images count by location, use a clustered bar chart.
- Select the clustered bar chart option.
- On the right data pane, choose images[location] and DAX measure: Images.
7. To show the images count by season, use a clustered bar chart.
- Select the clustered bar chart option.
- On the right data pane, choose Annotation[season] and DAX measure: Images.
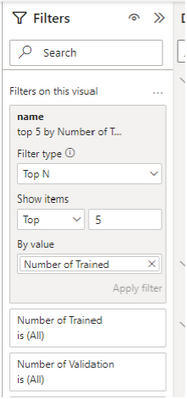
8. To compare the Train and Val tables, use a Line and Clustered Column chart.
- Select the Line and Clustered Column chart option.
- X-axis: name
- Column Y-axis: number of train
- Line Y axis: Number of Val
- Filter it to Top 5 by using the filter pane. See the picture below.
Finally, this results in:
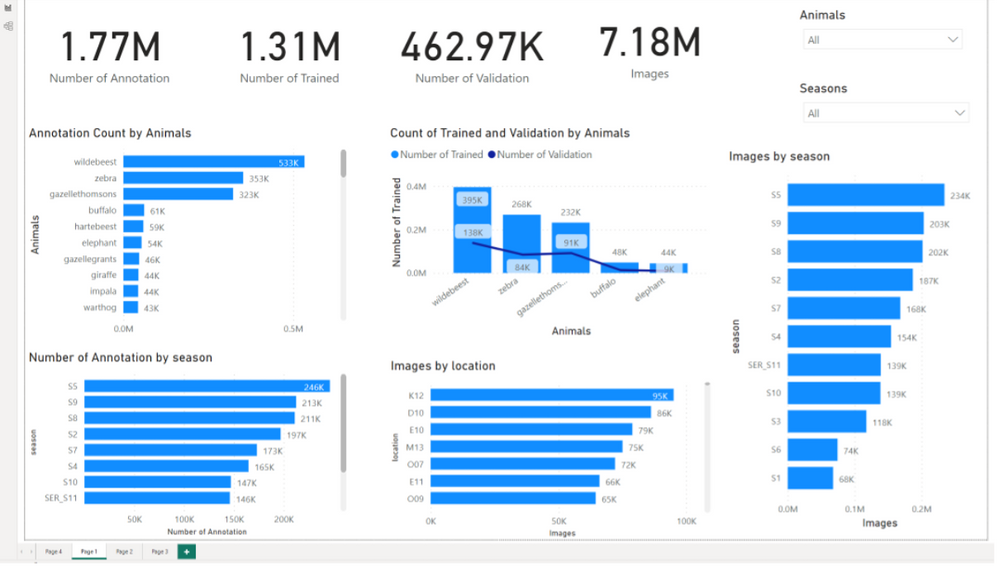
Now that we have created the Power Bi reports, publish them to the Power BI service.
Power BI linked services in Azure Synapse Analytics
Navigate back to the synapse workspace and click on the “Linked Services” option under the “Manage” section.

Now you can access your Power BI reports directly in Azure Synapse Analytics. Check out Quickstart: Linking a Power BI workspace to a Synapse workspace to learn more.
Conclusion
In this article, we've covered how to link Power BI to Azure Synapse Analytics to create a data pipeline, as well as how to create a Power BI report and publish it to the Power BI service. In the upcoming articles, we'll explore how to link the Azure Machine Learning service with Azure Synapse Analytics and train your ML models.
Resources
For additional resources to get an in-depth understanding of the services discussed in this article take a look at this handy collection of resources:
- Azure Synapse Analytics Blog - https://aka.ms/SynapseBlog/
- Documentation - http://aka.ms/SynapseDocs
- Learning paths and modules - https://aka.ms/synapsemodules
- Azure Synapse YouTube videos - https://aka.ms/SynapseYouTube
- Microsoft Power bi Community - http://aka.ms/pbicom
Published on:
Learn moreRelated posts
We're moving!
We’re moving to the Analytics on Azure Tech Community! All new Azure Synapse Analytics content will be published there. In the next few days a...
Upgrade to Azure Synapse runtimes for Apache Spark 3.4 & previous runtimes deprecation
It is important to stay ahead of the curve and keep services up to date. That's why we encourage all Azure Synapse customers with Apache ...
ADF\Synapse Analytics - Replace Columns names using Rule based mapping in Mapping data flows
In real time, the column names from source might not be uniform, some columns will have a space in it, some other columns will not. For exampl...
Interpreting Script activity output json with Azure Data Factory\Synapse analytics
Script activity in Azure Data Factory\ Synapse analytics is very helpful to run queries against data sources mentioned here in this document.&...
Synapse Connectivity Series Part #4 - Advanced network troubleshooting and network trace analysis
Continuing the series of this blog posts I would like to go more advanced on troubleshooting connectivity issues. I would like to thank also&n...
Boost your CICD automation for Synapse SQL Serverless by taking advantage of SSDT and SqlPackage CLI
Introduction Azure Synapse Analytics Serverless SQL is a query service mostly used over the data in your data lake, for data discovery,...
Metadata-Based Ingestion in Synapse with Delta Lake
Overview The crucial first step in any ETL (extract, transform, load) process or data engineering program is ingestion, w...
Missing Fields Added to Dedicated SQL pool Diagnostic Settings Logs
Over the past year, customers have informed the team there were a set of key columns missing in the standalone Dedicated SQL pools (formerly S...
Using Azure DevOps with Synapse Workspaces to create hot fixes in production environments
Have you ever deployed a release to production only to find out a bug has escaped your testing process and now users are being severely impact...
Azure Synapse MVP Corner - March 2023
About this blog series Microsoft Most Valuable Professionals, or MVPs, are technology experts who passionately share their knowledge with the ...