
[ServiceBus] Using Azure Managed Grafana for Azure Service Bus
![[ServiceBus] Using Azure Managed Grafana for Azure Service Bus](https://techcommunity.microsoft.com/t5/image/serverpage/image-id/430647iD0214377CF03FDAF/image-size/original?v=v2&px=-1 "[ServiceBus] Using Azure Managed Grafana for Azure Service Bus")
Table of Content
-
What is Azure Managed Grafana?
-
Why use Azure Managed Grafana with Azure Service Bus?
-
Setup and Configuration
-
Adding variables
-
Conclusion
1. What is Azure Managed Grafana?
Azure Managed Grafana is a data visualization platform built on top of the Grafana software by Grafana Labs. This is a bit different to the Grafana that you download from the grafana.com in the sense of the platform as Azure Managed Grafana is deployed from Azure Portal.
Therefore, you can control and configure the settings of Azure Managed Grafana from the Azure Portal such as limiting access or permission via users by using Azure Active Directory from Access Control (IAM).
For more details, please visit aka.ms/azuremanagedgrafana
2. Why use Azure Managed Grafana with Azure Service Bus?
You can see Service Bus metric on the Portal as well. However, if you wanted to see various namespaces metric at once, you would need to open multiple web pages across your monitor or monitors.
By using Azure Managed Grafana makes things easier to see ServiceBus Metric through one single dashboard. Additionally, Azure Managed Grafana allows filtering via variables. With these filters you can easily control the variables and be able to see different metrics of Resource Groups or Names in one dashboard without having to go back and forth between web pages. This documentation will explain how to set the variables in the later part of the documentation.
Lastly, the integration with Azure is so easy. You don’t have to go through the hassle of finding the endpoint and so forth. Since Azure Managed Grafana does all that for you. Also, by using the Azure Managed Grafana, the built-ins are all there for you to use.
In conclusion, using Azure Manage Grafana with Service Bus will make your monitoring much easier and flexible to your taste!
3. Setup and Configuration
① Search Azure Managed Grafana on the Azure Portal search bar.


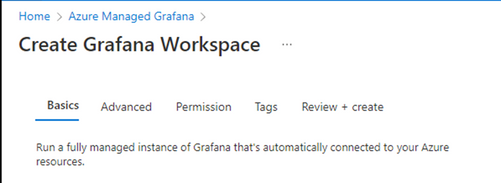
② Create Grafana Workspace
③ Once the resource has been fully deployed, go to the resource.
④ View Overview of the resource that you’ve just created and click on the Endpoint.
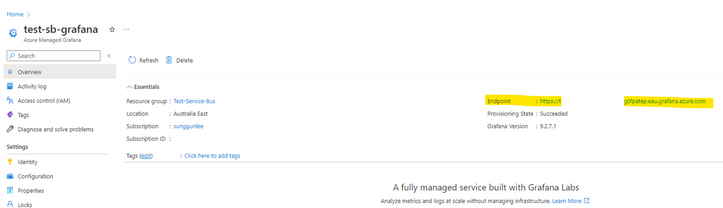
⑤ You will be seeing the Grafana dashboard and you need to complete the source.
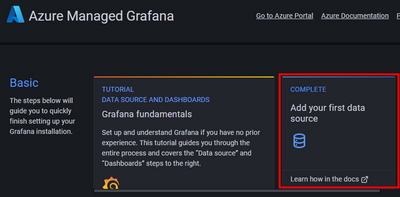
⑥ Search for Azure Monitor as below.

⑦ Select the subscription that you need to setup on the default subscription.
After press Save & Test and make sure you get Green Check box with successful connection.
Remember the name as this will be your Data Source.

⑧ Now you can start creating your dashboard by going to the Dashboard menu.
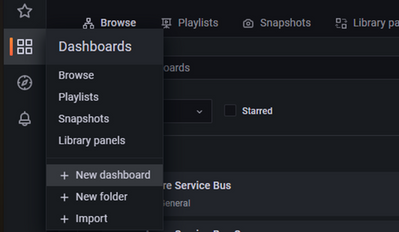
⑨ Add a new panel.

⑩ Make sure to set up the data source to Azure configuration setup earlier and select the resource you’d like to use as you will be able to see all the Resource Groups you own in the Azure Account.
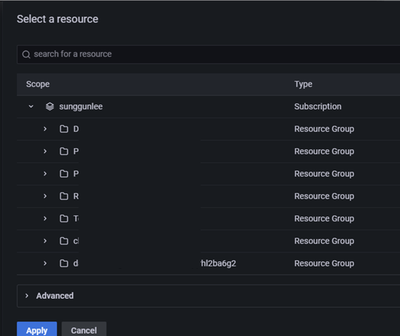
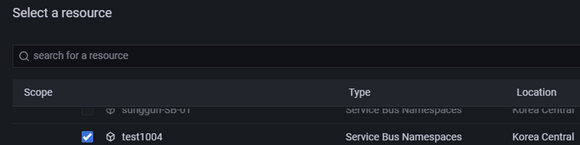
⑪ Select the Service Bus NameSpace as your scope
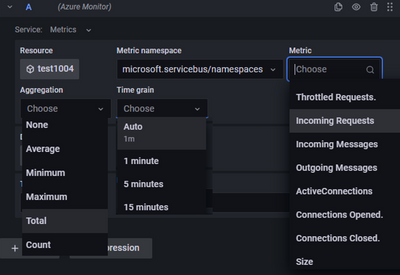
⑫ After selecting the resource, please choose the metric, aggregation and Time grain as you wish.
Make sure to give the title to this chart on the left Panel Options and save the Panel.
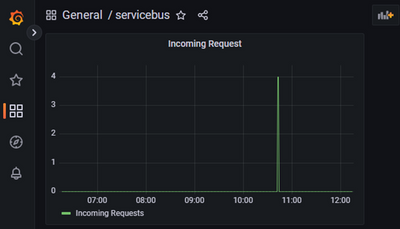
⑬ Once this is done, you will be able to see your Incoming Request metric on your dashboard.
3.1 Adding Variables
① Go to Dashboard setting on the right top corner.

② Go to Variables on the left menu and add new variables.
③ Change the query to the variable name you’d like.
- You need to add Resource Name and Resource Group

- In the preview, you should be seeing your Resource Names and Groups that are associated to the Service Bus Namespace
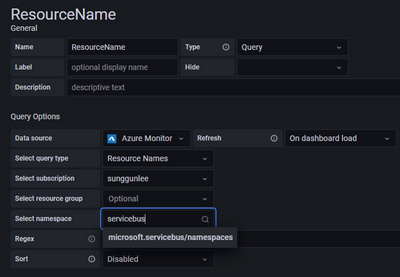
Make sure that you add microsoft.servicebus/namespaces when adding the Resource Name.
④ Once you’ve set up the variables in the dashboard as below you need to add the variable to the metric as well so that it will change as the variable selected.

⑤ Select the metric and go to edit and press the resource in A query.

Go to Advanced, by toggling down the arrow. Add the variable as the name you’ve made with the $.
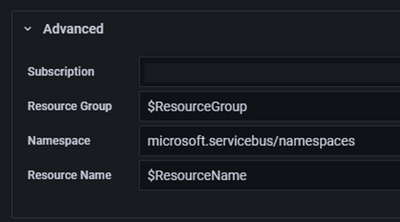
And make sure the Metric, Aggregation and Timegrain are all configured as they do get rested.
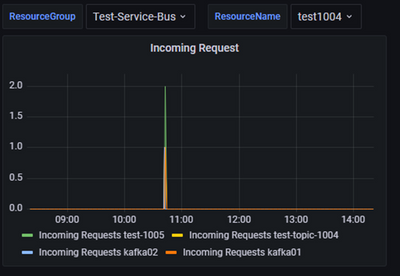
4. Conclusion
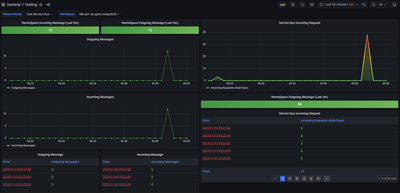
You can set your Dashboard as you like and stream the metric you wish on the Grafana dashboard. Also, it doesn’t just have to be Service Bus only.
You can have Storage Metric or other products along with other metrics in one dashboard.
Hope this setup documentation helped you out with setting up Azure Service Bus Metrics on Azure Managed Grafana.
Published on:
Learn moreRelated posts
Azure Storage - TLS 1.0 and 1.1 retirement
Overview TLS 1.0 and 1.1 retirement on Azure Storage was previously announced for Nov 1st, 2024, and it was postponed recently to 1 year later...
Efficient Management of Append and Page Blobs Using Azure Storage Actions
Overview In Azure Storage, Blob Lifecycle Management (BLM) allows you to automate the management of your data based on rules defined by...
[Azure AI Search] Internal Server Error when creating CMK encrypted objects
Scenario Customers follow the Microsoft doc to create CMK encrypted objects (data source, index etc.), but get the 500 Internal Serv...
Optimizing Azure Table Storage: Automated Data Cleanup using a PowerShell script with Azure Automate
Scenario This blog’s aim is to manage Table Storage data efficiently. Imagine you have a large Azure Table Storage that accumulates logs from ...
Optimizing Azure Table Storage: Automated Data Clean-up using a PowerShell script with Azure Automat
Scenario This blog’s aim is to manage Table Storage data efficiently. Imagine you have a large Azure Table Storage that accumulates logs from ...
Restoring Soft-Deleted Blobs with multithreading in Azure Storage Using C#
Blob soft delete is an essential feature that safeguards your data against accidental deletions or overwrites. By retaining deleted data for a...
Performing simple Azure Table Storage REST API operations using curl command.
The blog provides guidance to perform simple Table Storage REST API operations such as Create table, Delete Table, Insert entity, Delete entit...
Bulk delete all the old jobs from the batch account
Deleting a Job also deletes all Tasks that are part of that Job, and all Job statistics. This also overrides the retention period for Task dat...
Utilizing Azure Storage and Runbooks for scheduled automated backups of Azure SQL Databases
In this article, we are going to provide detailed steps to create a scheduled Azure SQL Database backup to storage account using automation. T...
[Azure Service Bus] JMS messages getting dead-lettered
The article discusses a problem where numerous messages end up in the dead letter queue (DLQ) when the JMS service bus consumer connects to th...