
Tool Introduction on How to Efficiently Read Azure Storage Diagnostic Logs

Many users choose to enable Storage Diagnostic logs in order to track and audit all success and fail requests for audit, security or troubleshooting purposes. And there are times you may need to analyze the logs to get more insights, for example, to analyze how many requests happening related to different client Ip addresses, containers, etc. As we know, the Diagnostic log (classic) is recorded in hourly manner in a container called $logs. Within this container, there are multiple levels of subfolders. If you have a high volume of log data with multiple files for each hour, it’s quite difficult to combine and view these logs together. This blog introduces two methods to view and analyze the large size of Azure Storage Diagnostic logs.
The most efficient way is to enable the diagnostic setting for storage account and save the logs to the Log Analytics Workspaces on Azure. Log Analytics Workspace Overview Create Diagnostic Settings In the Log Analytics Workspaces, you can write queries to retrieve and filter logs based on the rules you set. However, the Log Analytics Workspaces have extra cost. You can check the document for more details about the pricing of Log Analytics Workspaces Log Analytics Workspaces Pricing.
Besides the Log Analytics Workspaces, there are two other open-source options for you to choose. Both are free of charge.
Method 1: Azure Storage Log Reader
You can download this tool from this link Download Azure Storage Log Reader.
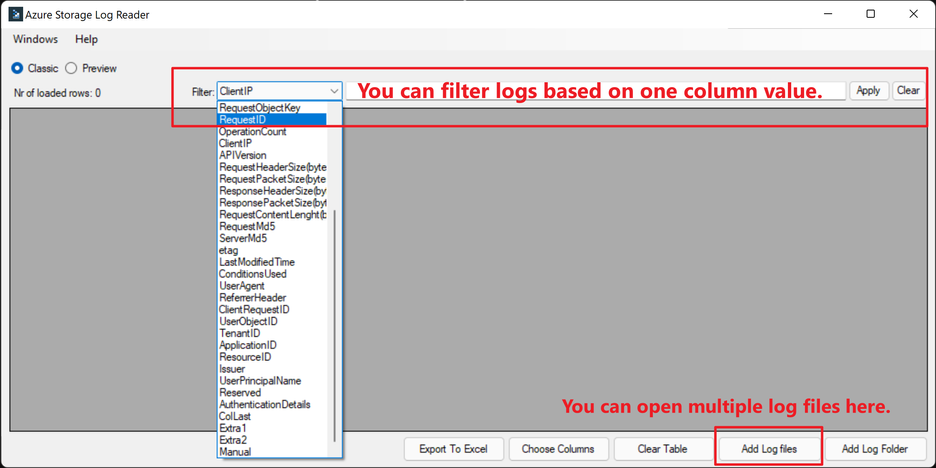
This tool allows you to add multiple files once, filter logs and do sorting based on one column. Also, you can export the combined log file to Excel. However, this tool has limitations. You cannot do group-by with this tool. Also, it cannot handle too much data and you can easily encounter throttling errors.
Method 2: Python Code
To overcome the limitations of the first method introduced above, another method is shared here which can work with more data.
Let’s assume that you want to group the requests by client IP address and count the total number of requests coming from each IP address. For the example logs used in this blog, there are 340 log files including more than 7 million records in total. So, it easily results in throttling error when you use Excel or other text editor tools to open it directly. However, by using Python, you can easily loop through all the subfolders, read in all the log files, and do the filtering or other analysis work based on that.
Usually, we have much more layers of the folder structure starting from year, month, day, and so on in your storage account. In this case, we only use logs for one day as an example. I have a folder structure like below. The Python code provided is based on this folder structure. The parent folder called “Logs” contains Storage logs for one day.

What the code does is to read all the log files into one table in Python, do some simple filtering and grouping work, and finally save the results as csv files for you.
How to run the script:
This Python Code provided is written in Jupyter Notebook which is a web-based interactive computing platform for Python. Other Python editor tools are also working if you are familiar with Python already. The easiest way for a beginner to get started with Jupyter Notebooks is by installing Anaconda.
Below are steps for starters of Python to run the script:
- Install Anaconda and complete setup following the link. Jupyter Notebook Tutorial Download Anaconda
- Download the Storage Diagnostic Log Reader.ipynb file from Python Sample Code.
- Run Jupyter Notebook, and upload Storage Diagnostic Log Reader.ipynb file and log files.

- Open the Storage Diagnostic Log Reader.ipynb file.
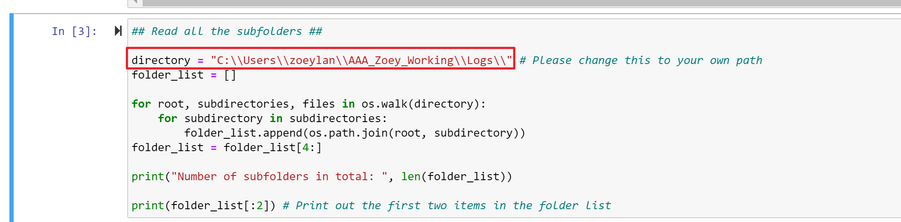
- Locate the directory in In[3] and replace it with the absolute path of the log root folder.
- Click the "Kernel" and "Restart & Run All" to run the Python code.

How to do basic analysis:
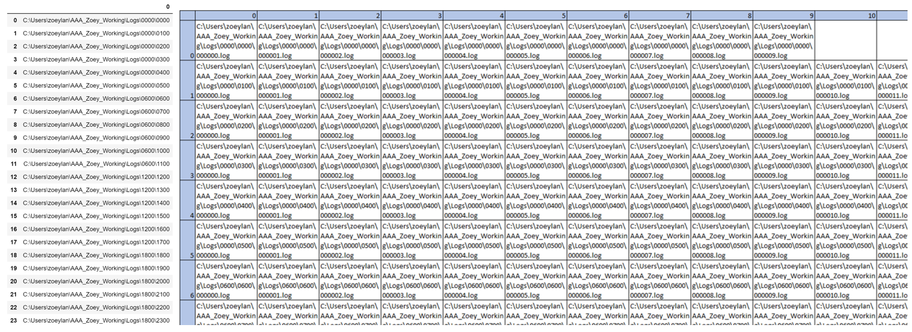
The first step in the sample code is to loop through all the subfolders, one subfolder for one hour. Then the code retrieves log files from all the subfolders and saves file names in one table like below.
At this point, another loop is used to read in all logs from these log files and save them into a huge table in Python.
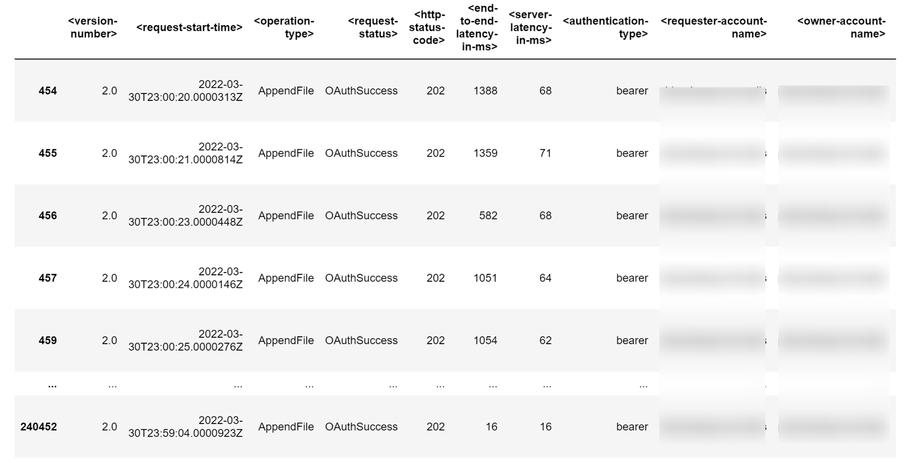
Then, you can do a filtering on the data to filter our all the “AppendFile” requests.
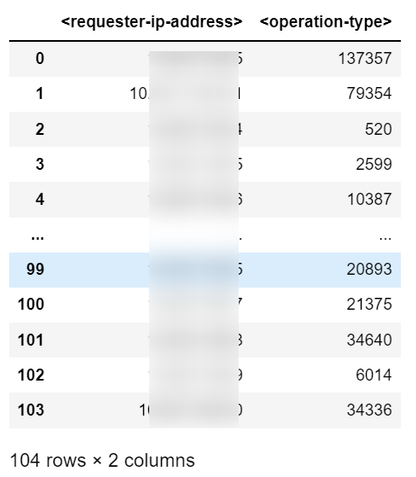
The next step is to count how many “AppendFile” requests are sent from each client IP address.
Since there might be some duplicate records from same requester-ip-address across all the log files, an extra sum up is needed to calculate the total number of requests.
Now, you have your analysis result ready, you can save it as a CSV file and open it with Excel on your local machine if you want.
Additionally, you can also analyze more columns. For example, you want to group requests by "request-url", "user-object-id", and "application-id" at the same time.
Then, you need to remove the duplicates and sum them up.
With this final result, we can easily tell the write operation was actually separated into multiple parts for upload and we can get the totally number of separated parts.

To sum up, this blog shares two free methods to view the Azure Storage Diagnostic Logs and do simple analysis to help you understand the requests sent to your Storage Account.
Published on:
Learn moreRelated posts
Azure Storage - TLS 1.0 and 1.1 retirement
Overview TLS 1.0 and 1.1 retirement on Azure Storage was previously announced for Nov 1st, 2024, and it was postponed recently to 1 year later...
Efficient Management of Append and Page Blobs Using Azure Storage Actions
Overview In Azure Storage, Blob Lifecycle Management (BLM) allows you to automate the management of your data based on rules defined by...
[Azure AI Search] Internal Server Error when creating CMK encrypted objects
Scenario Customers follow the Microsoft doc to create CMK encrypted objects (data source, index etc.), but get the 500 Internal Serv...
Optimizing Azure Table Storage: Automated Data Cleanup using a PowerShell script with Azure Automate
Scenario This blog’s aim is to manage Table Storage data efficiently. Imagine you have a large Azure Table Storage that accumulates logs from ...
Optimizing Azure Table Storage: Automated Data Clean-up using a PowerShell script with Azure Automat
Scenario This blog’s aim is to manage Table Storage data efficiently. Imagine you have a large Azure Table Storage that accumulates logs from ...
Restoring Soft-Deleted Blobs with multithreading in Azure Storage Using C#
Blob soft delete is an essential feature that safeguards your data against accidental deletions or overwrites. By retaining deleted data for a...
Performing simple Azure Table Storage REST API operations using curl command.
The blog provides guidance to perform simple Table Storage REST API operations such as Create table, Delete Table, Insert entity, Delete entit...
Bulk delete all the old jobs from the batch account
Deleting a Job also deletes all Tasks that are part of that Job, and all Job statistics. This also overrides the retention period for Task dat...
Utilizing Azure Storage and Runbooks for scheduled automated backups of Azure SQL Databases
In this article, we are going to provide detailed steps to create a scheduled Azure SQL Database backup to storage account using automation. T...
[Azure Service Bus] JMS messages getting dead-lettered
The article discusses a problem where numerous messages end up in the dead letter queue (DLQ) when the JMS service bus consumer connects to th...