12 Days of Paginated Reports - Day 11 - Indicators and Databars
Colour-coded indicators and databars can drastically improve the readability of your paginated reports. By adding these elements, readers can ...
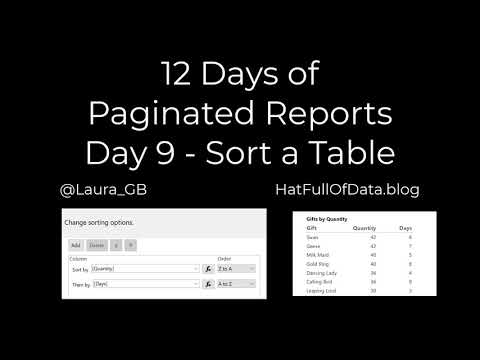
On Day 10 of Paginated Reports, the focus is on filtering tables to display top 5 rows. This video tutorial demonstrates how to achieve this u...
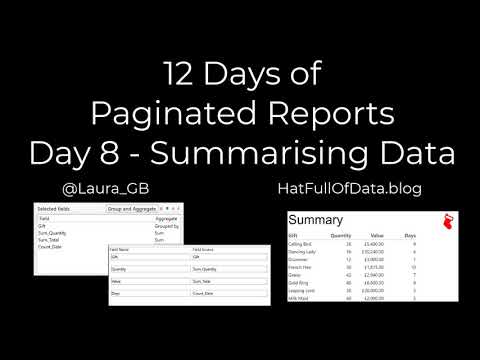
On the eighth day of paginated reports, we focus on the art of summarizing data. In some cases, the detail of individual rows may not be neces...
Join in on the 12 days of Paginated Reports, where you learn valuable techniques to enhance your reports. On Day 7, learn how to add grouping ...
In this video, you'll learn how to add page headers and repeating rows on tables to your paginated reports. When a report spans across multipl...
This video tutorial offers a comprehensive guide to combining the features of Microsoft Graph with Power Apps Canvas App and Power Automate. B...
In this episode of Power Platform Unpacked, you'll learn how to approach app creation with an app maker mindset. The video focuses on the drag...
Azure
Microsoft 365 Sharepoint
Newsletter
A curated digest of community blogs, product news, videos, and podcasts — delivered without the noise.