
Why is the Azure Monitor chart showing dashed lines for the Availability metric?

Have you ever noticed the dash lines on the "Availability" Azure Monitor metric for your Storage Account? What's that about? Is your Storage Account down?
Why is it that we see sections where there is a dashed line and other sections where there is a solid line?
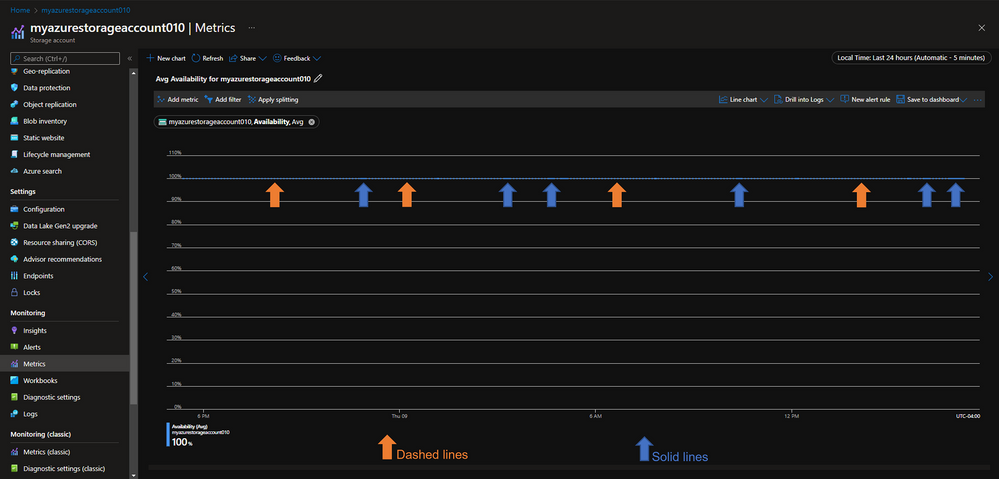
Well, it turns out that Azure metrics charts use dashed line style to indicate that there is a missing value (also known as “null value”) between two known time grain data points. Meaning, this behavior is by design, yes, by design. It is useful for identifying missing data points. The line chart is a superior choice for visualizing trends of high-density metrics but may be difficult to interpret for the metrics with sparse values, especially when corelating values with time grain is important.
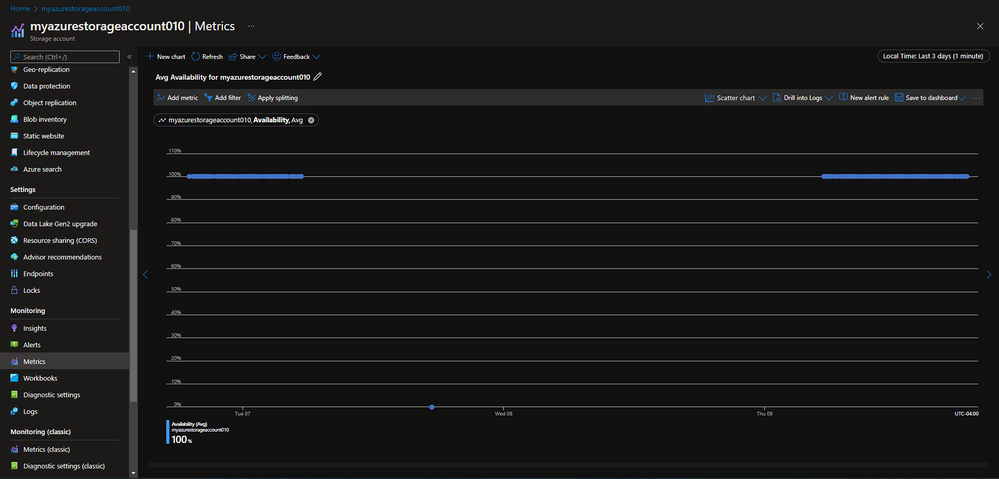
The dashed line makes reading of these charts easier but if your chart is still unclear, consider viewing your metrics with a different chart type. For example, a scattered plot chart for the same metric clearly shows each time grain by only visualizing a dot when there is a value and skipping the data point altogether when the value is missing, for my case this is what I get just after selecting the scatter chart:

So, by using the scatter chart is a lot clearer now where are the missing data points. But why would there be any missing data point for the "Availability" Azure Monitor metric in the first place?
Well, it turns out that the Azure Storage Resource Provider only reports the Availability data to Azure Monitor when there is ongoing activity, meaning, when the Storage Resource Provider is processing requests on any of its services (blob, queue, file, table). If you are not sending any requests to your Storage Account, you should expect the "Availability" Azure Monitor metric to show big sections of dashed lines and understand that this is by design.
This is critical because if you don't know this, you may think that the following chart shows that your Storage Account has been "unavailable" for several hours:
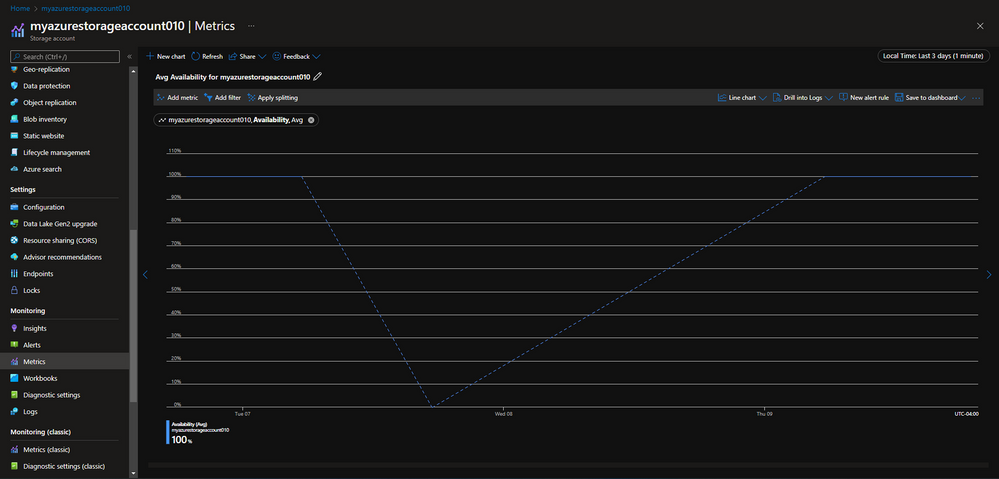
However, by taking a look at the scatter chart, we know now that there was a lot of inactivity on this Storage Account, and that at some point only 1 datapoint was showing "no availability", after which there was also an important gap again reflecting a period of no activity, for the Storage Account to then start receiving requests and for the "Availability" Azure Monitor metric to show 100% again:
References
========
Chart shows dashed line
Published on:
Learn moreWe can help you with Why is the Azure Monitor chart showing dashed lines for the Availability metric?
If you want help implementing, troubleshooting, or improving this product, contact us and we’ll point you in the right direction.
Related posts
Azure Storage - TLS 1.0 and 1.1 retirement
Overview TLS 1.0 and 1.1 retirement on Azure Storage was previously announced for Nov 1st, 2024, and it was postponed recently to 1 year later...
Efficient Management of Append and Page Blobs Using Azure Storage Actions
Overview In Azure Storage, Blob Lifecycle Management (BLM) allows you to automate the management of your data based on rules defined by...
[Azure AI Search] Internal Server Error when creating CMK encrypted objects
Scenario Customers follow the Microsoft doc to create CMK encrypted objects (data source, index etc.), but get the 500 Internal Serv...
Optimizing Azure Table Storage: Automated Data Cleanup using a PowerShell script with Azure Automate
Scenario This blog’s aim is to manage Table Storage data efficiently. Imagine you have a large Azure Table Storage that accumulates logs from ...
Optimizing Azure Table Storage: Automated Data Clean-up using a PowerShell script with Azure Automat
Scenario This blog’s aim is to manage Table Storage data efficiently. Imagine you have a large Azure Table Storage that accumulates logs from ...
Restoring Soft-Deleted Blobs with multithreading in Azure Storage Using C#
Blob soft delete is an essential feature that safeguards your data against accidental deletions or overwrites. By retaining deleted data for a...
Performing simple Azure Table Storage REST API operations using curl command.
The blog provides guidance to perform simple Table Storage REST API operations such as Create table, Delete Table, Insert entity, Delete entit...
Bulk delete all the old jobs from the batch account
Deleting a Job also deletes all Tasks that are part of that Job, and all Job statistics. This also overrides the retention period for Task dat...
Utilizing Azure Storage and Runbooks for scheduled automated backups of Azure SQL Databases
In this article, we are going to provide detailed steps to create a scheduled Azure SQL Database backup to storage account using automation. T...
[Azure Service Bus] JMS messages getting dead-lettered
The article discusses a problem where numerous messages end up in the dead letter queue (DLQ) when the JMS service bus consumer connects to th...