Breaking Down Power BI Visuals: Which Charts Work Best for Your Data?
A report is a collection of interactive visualizations and data representations, built on top of datasets, to convey specific insights and tre...
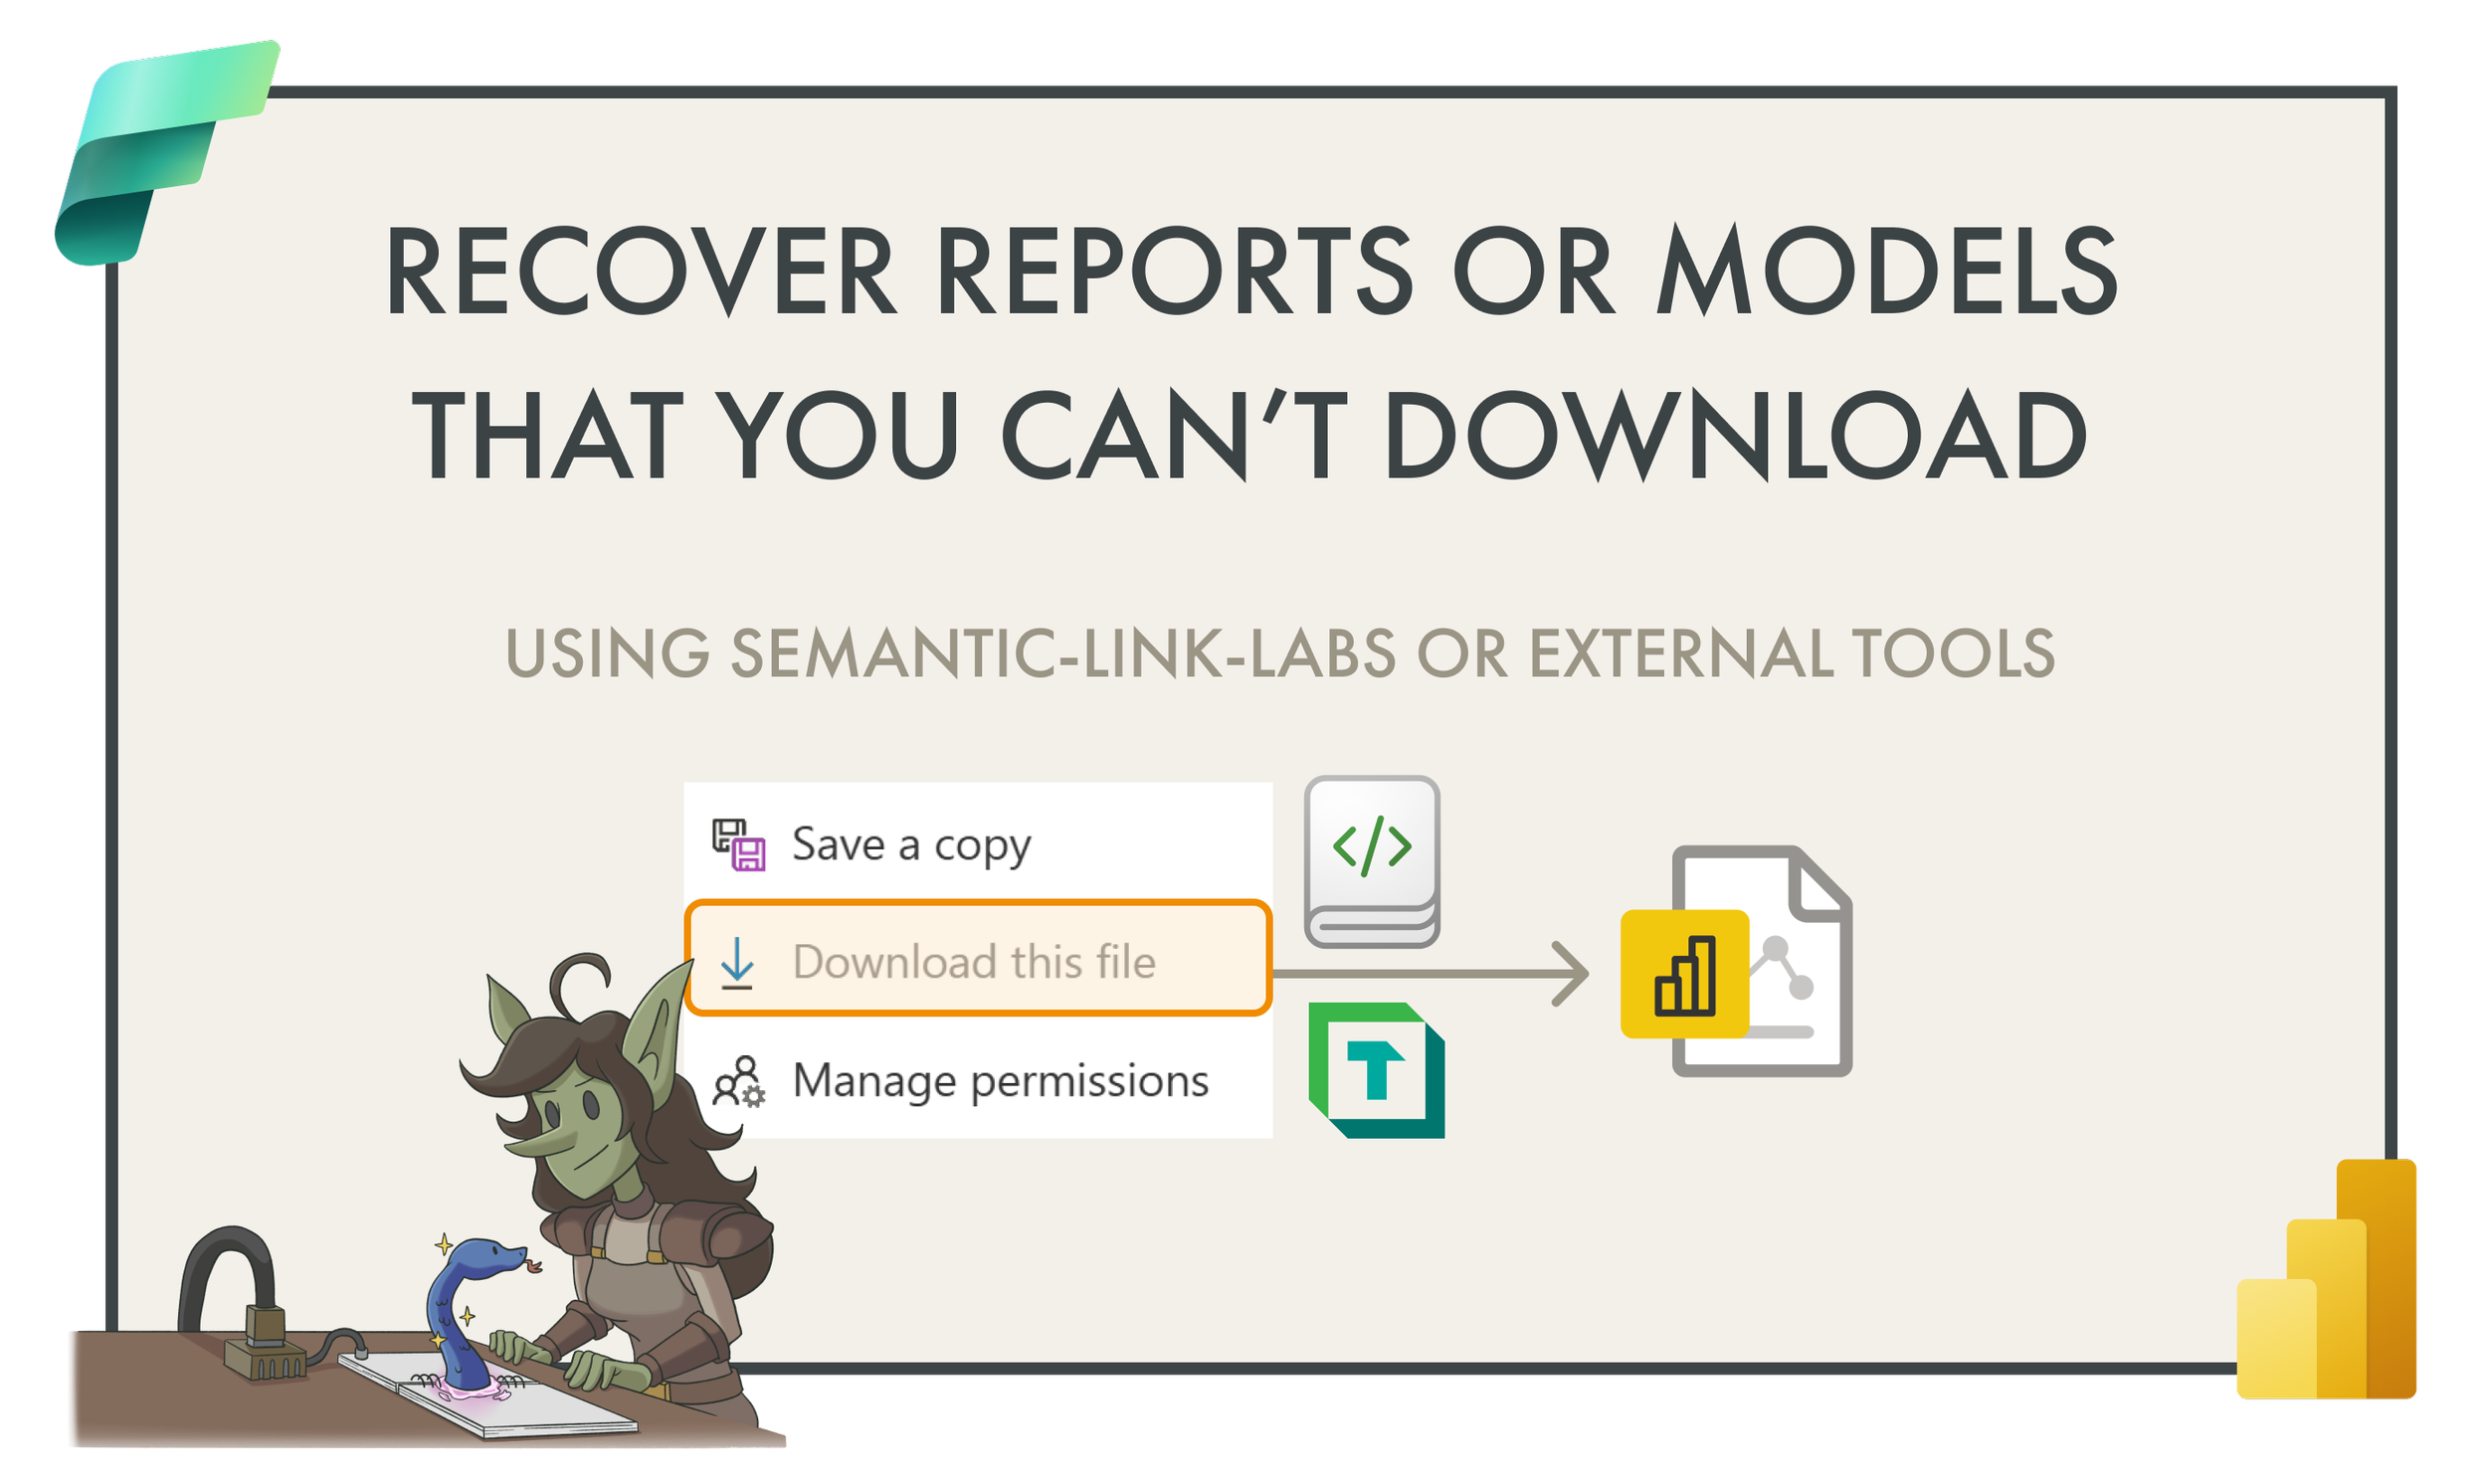
I explain several approaches to recover models and reports from a Power BI workspace when the Download this file (.pbix) option is greyed out....
A short(ish) explanation of how ad networks work and why I don't want them on my website The post Why I don’t have ads in the site? appe...
A short(ish) explanation of how ad networks work and why I don't want them on my website
Exact matching is a critical process for identifying precise matches between text data and predefined keywords. In this blog, we’ll walk you t...
Managing and optimising shared semantic models in Microsoft Fabric, with a focus on securing access, is essential in today’s data-driven...
Table of Contents Introduction The gap between rhetoric and reality is closing with Artificial Intelligence (AI) taking on every aspect…...
Azure
Microsoft 365 Sharepoint
Newsletter
A curated digest of community blogs, product news, videos, and podcasts — delivered without the noise.