Business Continuity with ABCC: Part 5: Monitoring protection
Credits: This blog post has been reviewed by @Aditya_Balaji, @GargiBanerjee.
Hello everyone! This is Daya Patil here, continuing our series on business continuity with ABCC. In our previous session, we explored the concept of understanding the inventory of protected items in ABCC through Business Continuity with ABCC: Part 4: optimize security - Microsoft Community Hub. Today, we're going deeper into monitoring journey for John within ABCC.
Tailwind Traders case study
With all configurations and protections set up, John now must monitor the daily status to ensure the desired Recovery Point Objective (RPO) is consistently met. It's crucial for him to receive notifications promptly in case of any failures to achieve this objective, enabling him to take immediate remedial action. His next objectives are:
- Monitor daily status of backups and replication
- Monitor alerts and configure notifications
- View metrics
John remembers using several automation tools in his previous company to create customized views for monitoring tasks. However, this effort came with the challenge of maintaining and updating these views whenever there were changes to automation clients and BCDR (Business Continuity and Disaster Recovery) solutions.
Monitor jobs:
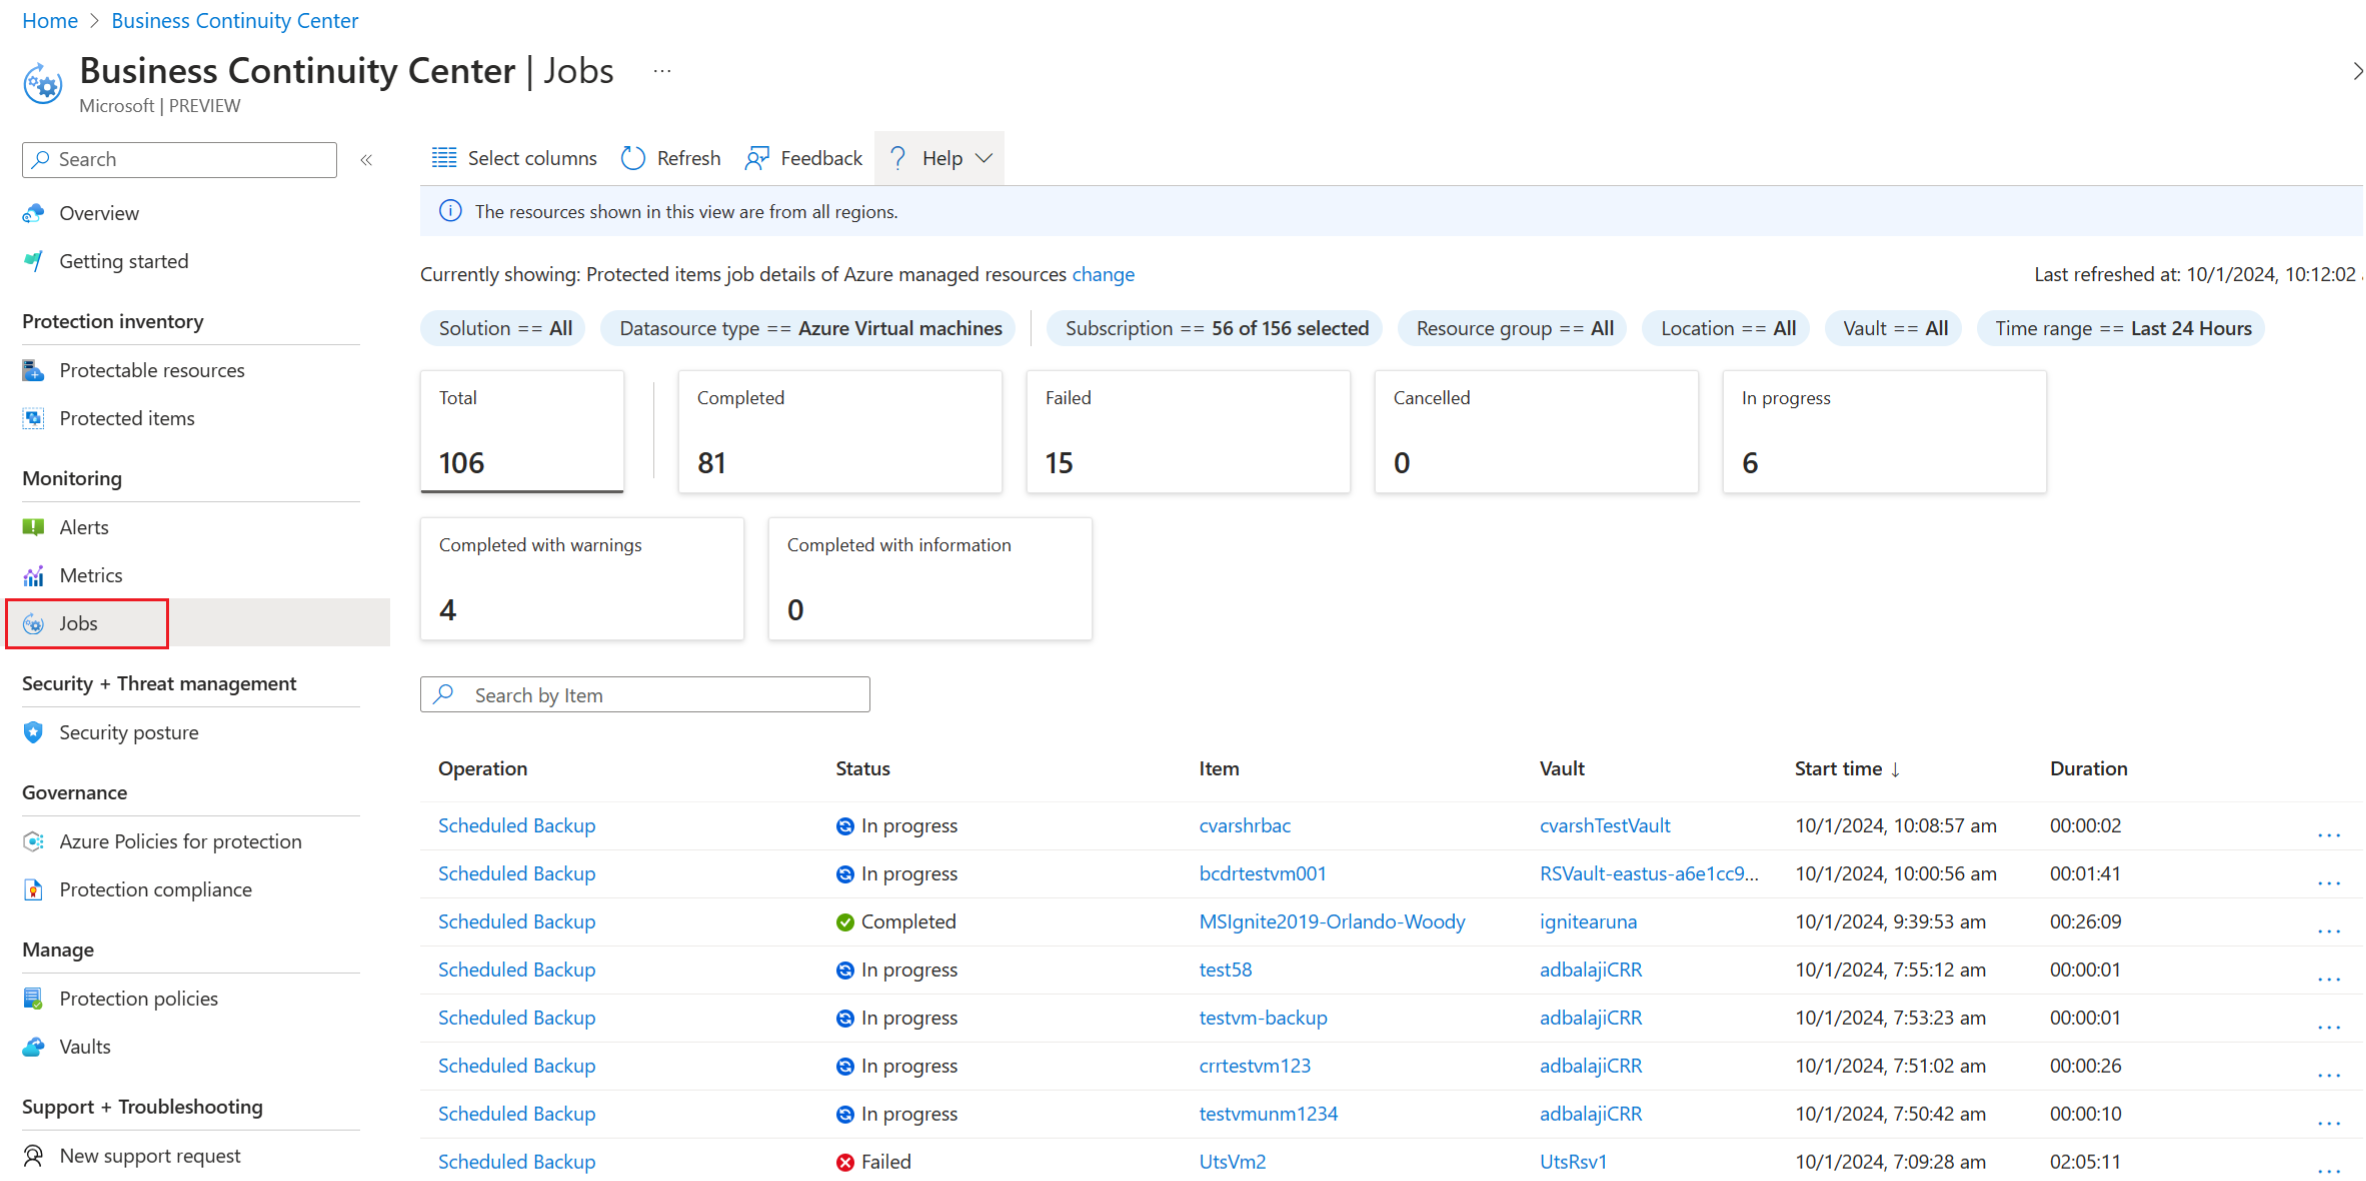
John navigates to Azure Business Continuity Center and notices there is a separate dedicated section with various views to help him with the monitoring. He clicks on the view for jobs. The Jobs view helps him monitor the progress of actions triggered across the solutions. ABCC allows to view jobs across Azure Backup and Azure Site Recovery, with ability to filter, view details of individual jobs and take appropriate action.

Within the jobs view, John can find the action details for each resource using the following information:
- Summary cards displays count of total jobs and based on various states of jobs, based on applied filters at the top of view. The summary adapts to changes in the applied filters and is interactive, allowing further filtering to view jobs with specific states.
- Jobs: Within this view, each job is accompanied by the following information:
- Operation: Displays the name of the specific operation.
- Status: Indicates the current state of the job, such as Completed, Failed, Cancelled, In Progress, Completed with Warning, or Completed with Information.
- Item: Shows the name of the protected item, and clicking on it leads the view where additional details about the protected item can be viewed.
- Vault: Specifies the name of the vault where the item is protected. Clicking on it provides further insights into the vault.
- Start Time: Provides the timestamp for when the operation or action commenced.
- Duration: Indicates the duration or the elapsed time since the action began.

Customize the Jobs view
John observes a couple of additional options on the page that enable customization of the view like:
- Filters: John uses these filters to tailor the displayed information according to his specific requirements. Available filters encompass aspects like solution, data source type, subscription, resource group, location, vault, time range, and more.
- Scope: John also notices the scope feature, enhancing visibility across various monitoring estates, including Azure and Hybrid environments. Clicking on "Currently showing: Protected items job details of Azure managed resources change" reveals a range of available options, such as:
- Resources managed by: Azure, non-Azure
- Job Source: Protected items, other
- Protected items: Use this option to view jobs that are for the actions associated with a protected item, like backup, restore, test failover, etc.
- Other: Certain solutions have jobs linked to different entities like network, replication policy, etc. Choosing the "Other" option shows information on such jobs.

- Search: John could also search by specific item name to get jobs specific to it.
- Select columns: Use Select columns from the menu available at the top of the views to add or remove columns.
View Job details
John aims to delve deeper into the details of each job, particularly those that haven't completed successfully for specific resources. To do so, he clicks on the operation name or opts for the "More" icon and selects "View Details" from the action menu. This allows him to navigate and explore further details pertaining to a particular job.

In the job detail’s view, John gains access to additional information directly from the provider. This encompasses details like resource ID, activity ID, and sub-task specifics such as name, status, and duration for each.

The built-in help available from the menu within the view assists John in learning more about utilizing the view effectively.
Having access to a comprehensive array of customizable options, detailed insights into job statuses, and extensive provider-specific information within the job view, John experiences a sense of empowerment and satisfaction. Though feeling equipped and informed by the comprehensive visibility for effective task management and monitoring, John seeks to minimize his ABCC progress checks. His goal is to concentrate solely on critical event failures instead of constant monitoring. Additionally, he desires notifications for immediate attention needs, allowing him to stay informed without the need for continual monitoring.
Monitor alerts and configure notifications:
With his objective in mind, John navigates to the Alerts view. Here, he gains insights into alerts triggered for critical events in backup and disaster recovery operations. This view allows him to observe built-in alerts triggered by solutions like Azure Backup or Azure Site Recovery, along with alerts triggered by custom alert rules based on metrics and custom queries.

In the alerts view, John can access information about triggered alerts for resources through the following sections:
- Summary cards These cards display the total count of fired alerts categorized by severity, adapting to applied filters at the top of the view. Clickable cards facilitate further filtering to view alerts based on specific severity.
- Alerts Each alert in this view contains the following details:
- Severity: Indicates the severity level of the alert, such as error, warning, critical, informational, or verbose.
- Alert rule: Displays the name of the specific alert rule.
- Category: Specifies the category of the alert, aiding in understanding its relation to health, security, or jobs.
- Alert based on: Indicates the resource type to which the alert is applicable.
- Impacted items: Provides a count of impacted resources related to the fired alert.
- Alert type – Specifies whether the alert is built-in or custom.

To explore the impacted or affected items related to a specific alert, you can choose "View affected resources" from the context menu.

The affected resources view provides comprehensive details for all those resources to which the fired alert applies, including subscription, resource group, location, start time, state, and more.

Customize the Alerts view
John observes similar options on the page that enable customization of the view like:
- Filters: Help to tailor the displayed information according to his specific requirements. Available filters encompass aspects like solution, subscription, resource group, location, category, severity, time range, and more.
- Scope: John also notices the scope feature, enhancing visibility across alerts from various monitoring estates, including Azure and Hybrid environments. Clicking on " Currently showing: Alerts for Azure managed resources with Full details change" reveals a range of available options, such as:
- Resources managed by: Azure, non-Azure
- Alert details: full basic
The "Full" view offers an extensive range of filtering options, whereas the "Basic" view presents a simpler set of filters. Presently, the "Full" view is available exclusively for specific types of data sources, while alerts for other data source types are supported in the "Basic" view.

- Search: John could also search by alert rule name to get information specific to it.
- Select columns: Use Select columns from the menu available at the top of the views to add or remove columns.
Perform actions
John finds joy in discovering that all alert-related information is consolidated in one place, offering seamless options to switch between different functionalities. As he delves deeper, he uncovers a range of actions accessible within the view:
At the top of the view, the menu offers actions such as creating and managing alerts.
- Create: is a collection that houses various options for creating objects like alert rules, action groups, and alert processing rules.
- Create alert rules – This action enables the creation of various types of alert rules tailored to specific needs.
- Note - In addition to creating alert rules on the standard metrics that solutions like Azure Backup emit, John can now also create custom alert rules based on Azure Resource Graph (ARG) queries, for scenarios like ‘latest recovery point older than 3 days’, that spans across both Azure Backup and Azure Site Recovery protected items (An example alert rule template for this scenario can be found here).
- Create alert processing rules for alerts – This action involves establishing alert processing rules to apply specific actions on triggered alerts. These rules allow the addition or removal (suppression) of action groups from fired alerts. Alert processing rules can be applied to different resource scopes, ranging from a single resource to an entire subscription, provided they belong to the same subscription as the rule.
- Create action groups - Alerts are associated with action groups, which consist of notification preferences and actions. Action groups are comprised of:
- Type: The notification that's sent or action that's performed. Examples include sending a voice call, SMS, or email. You can also trigger various types of automated actions.
- Name: A unique identifier within the action group.
- Details: The corresponding details that vary by type.
- Create alert rules – This action enables the creation of various types of alert rules tailored to specific needs.

- Manage alerts: serves as a collection that consolidates various options for overseeing objects such as alert rules, their configurations, action groups, and alert processing rules.

- Manage alert rules – This view displays all your alert rules across subscriptions. It offers filtering options based on criteria like subscription, target scope, target resource type, signal type, severity, status, and more.

- Manage built-in alert settings – This feature enables you to view the vaults utilizing classic alerts, an older alerting solution. It's recommended to transition to Azure Monitor-based alerts for more effective monitoring. Learn more for further details.

- Manage action groups – This section displays all action groups across subscriptions. You can utilize available filters such as subscription, resource group, status, location, and more to refine the view according to your requirements.

- Manage alert processing rules – This section showcases all alert processing rules established across subscriptions. You can utilize available filters like subscription, resource group, target scope, status, rule type, and more to refine the displayed information according to your preferences.

John, having grasped the functionalities of all actions, now aims to configure the necessary components to receive email notifications in case of critical event failures.
Configure notifications:
To direct alerts to notification channels, you'll need to establish an alert processing rule and an action group. The alert processing rule specifies which alerts should be routed to a specific notification channel, while the action group represents that channel.
All Azure Monitor-supported action groups, including email, webhooks, functions, logic apps, etc., are compatible with backup and disaster recovery alerts as well. Below are the steps outlining how to configure email notifications for your alerts.
John begins with creating an alert processing rule.

In the Rule settings, selects Apply action group and Create action group (or use an existing one). It is the destination to which the notification for an alert should be sent.

For the creation of an action group, in the Basics tab John specifies the name of the action group, the subscription, and the resource group under which it must be created. Under the Notifications tab, for the destination of the notification, he selects as Email/ SMS Message/ Push/ Voice and enters his email ID and other details as necessary.

Upon creating the action group, John is directed back to the alert processing rule creation. The newly created action group is visible on the Rule Settings page. In the Scheduling tab, he opts for "Always" and finalizes the creation of the processing rule.

John's current state is of accomplishment and relief. Successfully configuring the system to alert him about critical event failures has instilled a sense of assurance and readiness. This setup allows him to stay informed without the requirement for continual manual monitoring.
View metrics:
John, within the Azure Business Continuity Center, has the capability to observe built-in metrics specific to business continuity scenarios. Moreover, you can activate alerts based on these metric values. Presently, only metrics related to Azure Backup are supported, such as Backup Health Events and Restore Health Events. To gain further insight learn more about the supported metrics and their definitions.
John clicks on the Metrics tab, and it opens the Azure Monitor metrics explorer. He selects the resource to view metrics for.

John explores the metric to view, “Backup Health events”.

To further see the metric values at lower levels of granularity, John uses filters available on the view. For example, a particular protected item within the vault.
