
Add a custom WebGL layer to Azure Maps

When developing with Azure Maps, in many cases, most of the functionality you need is available out of the box, but sometimes you need some extra power. For example, when you have a use case where you need to render 2D or 3D data on top of the map and the built-in functionality is not enough, the custom WebGL layer is an option. WebGL is a cross-platform, royalty-free open web standard for low-level 3D graphics in your browser. Azure Maps uses WebGL to render the map, significantly benefiting performance over drawing directly on the standard HTML canvas. However, because WebGL is a low-level programming model, it can be highly complex and is not always the best choice if you try to solve a business requirement. Luckily, the Azure Maps custom WebGL layer can be combined with powerful open-source 3D frameworks, like Babylon.js, Deck.gl, Three.js, and more, which makes it easier to handle 2D and 3D layers on the map. Using WebGL, you can build high-performance interactive graphics that render in the browser in real-time, supporting scenarios like simulations, data visualization, animations, and 3D modeling.
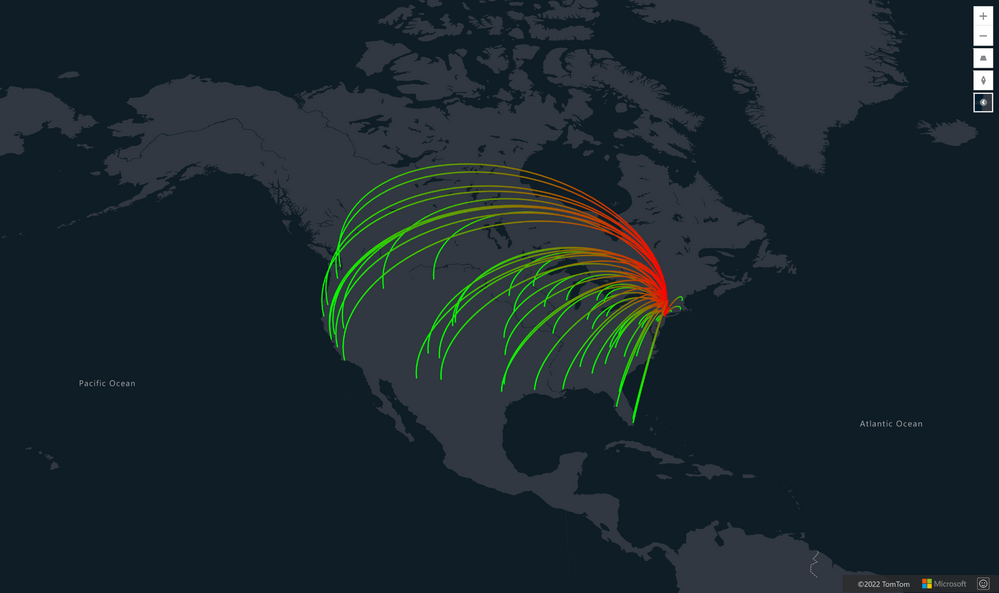
To add the custom WebGL layer to the map, we use the default map.layer.add() function and pass a new WebGLLayer layer. The WebGL layer needs a renderer object to handle your custom drawing on the map, and this is done by implementing the WebGLRenderer interface on your renderer object. Additionally, you can pass some extra options, like what zoom level the custom layer should be visible or not.
Azure Maps use the Spherical Mercator projection coordinate system (EPSG: 3857). A projection is a mathematical model that transforms the spherical globe into a flat map. The Spherical Mercator projection stretches the map at the poles to create a square map. The map's camera matrix is used to project spherical Mercator points to WebGL coordinates used in the custom WebGL layer.
Babylon.js
Babylon.js is a powerful, simple, real-time 3D and open game and rendering engine packed into a friendly framework, which Microsoft initially developed.
Deck.gl
Deck.gl is a WebGL-powered framework for visual exploratory data analysis of large datasets. deck.gl allows complex visualizations to be constructed by composing existing layers and makes it easy to package and share new visualizations as reusable layers.
Three.js
Three.js is an easy-to-use, lightweight, cross-browser, general-purpose 3D library.

To get started developing your custom WebGL layer, read our documentation or visit our samples site.
Published on:
Learn moreRelated posts
Introducing the Data-Bound Reference Layer in Azure Maps Visual for Power BI
Imagine managing a nationwide sales team and needing to understand how your sales align with factors like population density, competitor locat...
Enhance Azure Maps with Overture Maps Data using PMTiles!
Supercharge Azure Maps with Overture Maps Data using PMTiles! We’ve got some exciting news. Azure Maps now supports PMTiles! This me...
Where do I go if I have questions about Azure Maps?
As you might expect, just looking around on your own, or asking Co-pilot, you can find comprehensive help like Samples.AzureMaps.com, wit...
Tailor your Reference Layers in Azure Maps Visual for Power BI
We’re excited to share the latest enhancements to the Azure Maps visual in Power BI, designed to make your data visualization even mor...
Enhancing Logistics with Azure Maps and NVIDIA cuOpt for Multi-Itinerary Optimization
The logistics industry is always finding ways to optimize vehicle routing to enhance efficiency. The Vehicle Routing Problem (VRP) and Pickup ...
Introducing the Unified Azure Maps Experience
Microsoft has recently announced the unification of Bing Maps for Enterprise (BME) with Azure Maps, marking a remarkable advancement in their ...
Power BI Azure Maps Visual: Enhanced Reference Layer & Embedded Support
The Power BI Azure Maps visual has received a major update which includes an expansion of the reference layer and the addition of Power BI Emb...
Enhance your indoor maps with real-time map feature styling
The ability to dynamically update and visualize the state of rooms or areas within a building is critical to understanding the status of any b...
Dynamic Clustering Aggregation with Custom Styling in Bubble Layer
The Power BI Azure Maps visual allows you to create stunning geospatial visualizations with your data. Today, we are excited to announce a new...
HO HO HO Two Point OH!
You might notice some big changes have come to the North Pole experience at NORADSanta.ORG this year. Developer elves have implemented a...