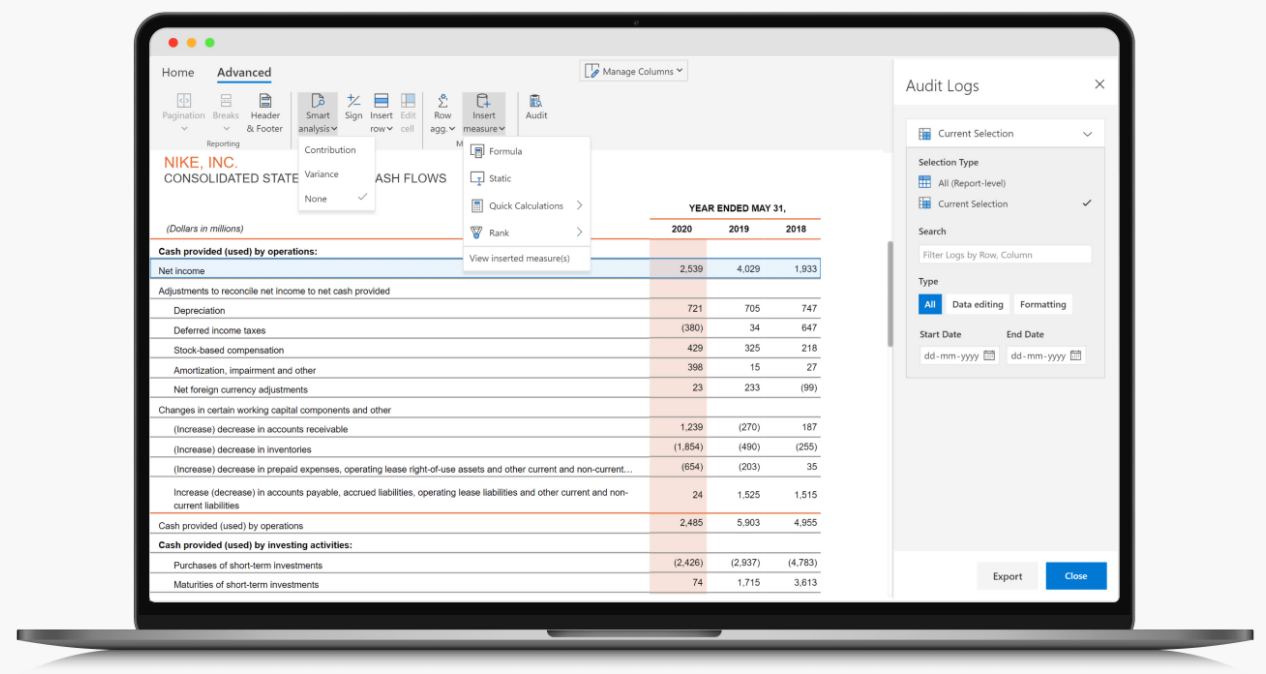
Build a Power BI P&L in 5 Mins with InfoRiver

Building a Profit and Loss statement (P&L) with Power BI may seem like a daunting task, but it can be accomplished in just 5 minutes with InfoRiver. The InfoRiver Power BI Custom visual simplifies the process by providing a user-friendly interface, making it quick and easy to generate a P&L. In this instructional video, you'll learn how to produce a P&L by following some simple steps, providing UI feedback, testing, and more.
Whether you're an experienced data analyst or just starting with Power BI, the InfoRiver Custom visual can help you create visually appealing, informative reports that are sure to impress your audience. So why wait? Check out the video and start building your P&L today!
Published on:
Learn moreRelated posts
Understanding What Data Modeling Is And Creating The Right Relationships
In this tutorial, you'll learn about the concept of data modeling and how to create the right relationships between different data tables in y...
Power BI Introduction Power BI Desktop | Power BI Service | Power Query | Data Modelling Data Visualization | Power BI Mobile Data Connectivity
Microsoft Power BI is a powerful and popular business intelligence and data visualization tool or suite developed by Microsoft. It enables use...
Power BI Copilot: Enhancing Data Analysis with AI Integration
If you're looking for an intelligent assistant to help you navigate your data analysis, then Power BI Copilot is the tool you need. This innov...
Pandas AI: Data Analysis With Artificial Intelligence
Pandas, a popular Python library for data analysis, has just received a boost in the form of Pandas AI. This new addition enables Pandas to di...
Power BI Financial Dashboard Examples: Let’s Get Specific
If you're looking to monitor an organization's financial performance in real-time, Power BI financial dashboards are a quick and easy way to d...
What is Azure Analysis Service and how to use it for Data Analytics with Power BI? #powerbi #azure
This video dives into the world of Azure Analysis Service and how it can be leveraged for data analytics in Power BI. Azure Analysis Service i...
Deep Dive into InfoRiver Export to Excel
This article dives deeper into the capabilities of the InfoRiver custom visual and demonstrates how exporting to Excel can enhance the user ex...
Microsoft Power BI Shifts Focus to Include Data Visualization
In a surprising announcement, Microsoft has decided to include data visualization in Power BI, shifting the tool's focus from being just a dat...
Inforiver Charts Power BI Custom Visual Part1 by taik18
This is a video tutorial by taik18 covering the Inforiver Charts Power BI custom visual. The tutorial may be split into multiple parts, and th...