Power BI Introduction Power BI Desktop | Power BI Service | Power Query | Data Modelling Data Visualization | Power BI Mobile Data Connectivity

Microsoft Power BI is a powerful and popular business intelligence and data visualization tool or suite developed by Microsoft. It enables users to transform raw data from various sources like Excel, SQL, OData, etc… into interactive and visually appealing dashboards, BI reports, and data visualizations. Power BI offers a range of features and functionalities that make it easier for individuals and organizations to analyze, explore, and share insights from their data. Tableau was considered one of the leading tools in the business intelligence world, but after introduced power BI by Microsoft, Power BI became more popular, this was due to its easiness of development and close integration with the Microsoft Office suite.
Key Components of Power BI:
1. Power BI Desktop
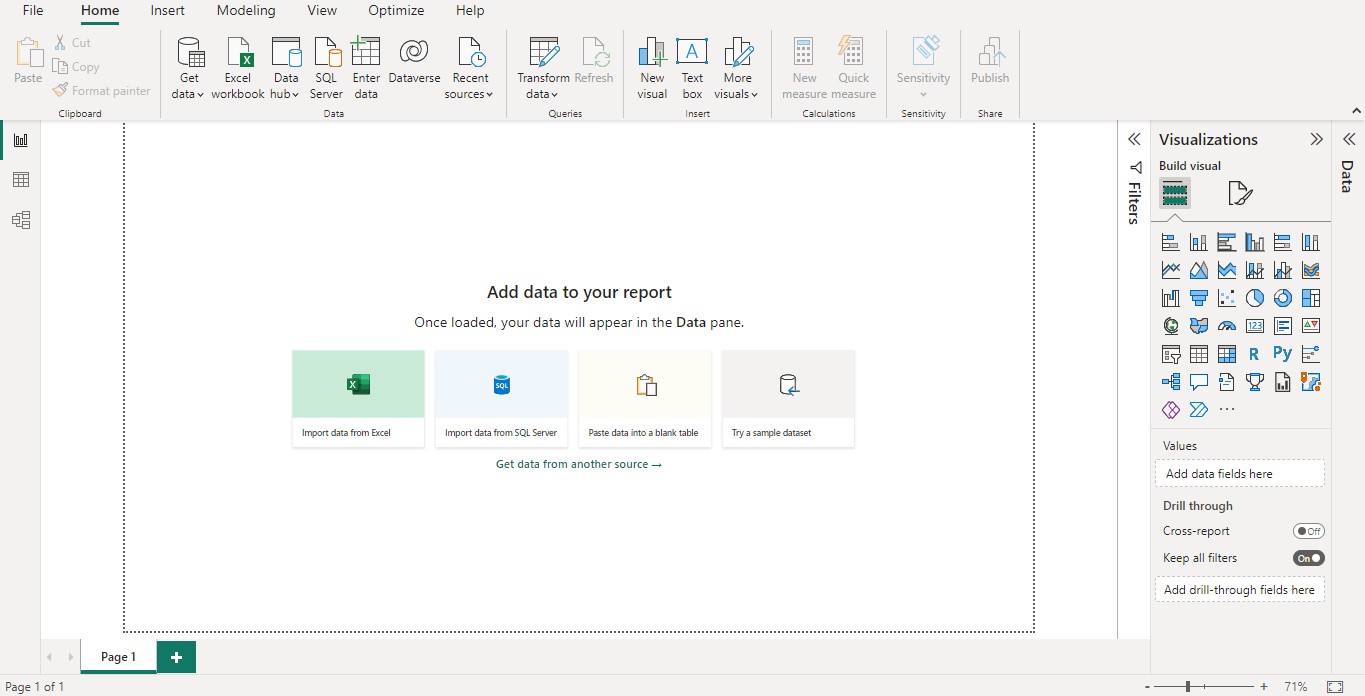
Power BI Desktop is the primary application for creating and designing Power BI reports and visualizations. Which is a Windows application, it provides a rich set of tools for data modeling, transformation, and visualization. Users can connect to various data sources, shape, and transform the data using Power Query, create relationships between different tables, and design interactive reports using a drag-and-drop interface. By using the Power BI desktop application, you can easily build queries, models and visualize data.
2. Power BI Service
Power BI Service, also known as Power BI Online or Power BI Cloud, is a cloud-based platform that allows users to publish, share, collaborate, and access Power BI reports and dashboards from anywhere. It provides features such as data refresh, scheduled data snapshots, collaboration tools, and centralized data governance.
3. Power Query
Power Query is a data preparation and transformation tool integrated into Power BI. It enables users to connect to different data sources, combine and shape data, perform data cleaning and manipulation operations, and load the transformed data into Power BI for analysis.
4. Data Modelling
Power BI allows users to create data models by establishing relationships between tables. It supports different types of relationships, including one-to-one, one-to-many, and many-to-many. Users can define calculated columns, measures, and hierarchies to enhance the data model and enable powerful analysis capabilities.
5. Data Visualization
Power BI offers a wide range of interactive visualizations, such as charts, graphs, maps, tables, and matrices, to represent data effectively. Users can customize the visual elements, apply filters, create drill-down and drill-through experiences, and add dynamic interactivity to their reports and dashboards.
6. Power BI Mobile
Power BI Mobile allows users to access their Power BI reports and dashboards on mobile devices. It provides a responsive and touch-friendly experience, enabling users to view and interact with their data on the go.
7. Data Connectivity
Power BI supports connectivity to a vast array of data sources, including databases (SQL Server, Oracle, MySQL, etc.), cloud services (Azure, Salesforce, Google Analytics, etc.), Excel files, SharePoint, and many more. It provides both direct query and data import capabilities, allowing users to choose the most suitable option for their data analysis requirements.
Power BI offers various licensing options, including free and premium plans, to cater to different user needs and organizational requirements. It has gained popularity among business analysts, data professionals, and organizations of all sizes due to its user-friendly interface, powerful capabilities, and seamless integration with other Microsoft products and services.
Published on:
Learn moreRelated posts
Power BI Report Server January 2026 Feature Summary
Welcome to January 2026 Power BI Report Server feature summary! These updates bring new capabilities and enhancements across Reporting and Vis...
Power BI Update - January 2026
Power BI January 2026 Feature Summary
IMPORTANT NOTE: The January Power BI Desktop release began rolling out today (1/20). Updates may take time to reflect in the desktop release. ...
Introducing Markers in Azure Maps for Power BI
We’re announcing a powerful new capability in the Azure Maps Visual for Power BI: Markers. This feature makes it easier than ever for organiza...
Measuring Time To Display For Image Visuals In Power BI With Performance Analyzer
Carrying on my series on troubleshooting Power BI performance problems with Performance Analyzer, another situation where a report may be slow...
Retirement of Power BI Q&A
Power BI Q&A, the legacy natural language tool, will retire by December 2026. New Q&A visuals cannot be created, and existing ones w...
Power BI: End of support for on-prem SharePoint web part
Support for the SSRS Report Viewer SharePoint Webpart ends April 13, 2026. It will remain functional but unsupported. Organizations should tra...


