Running NCBI BLAST on Azure – Performance, Scalability and Best Practice

Covid-19 pandemic, along with recent years’ breakthrough in molecular biology, have led to the exemptional use of the sequence databases. Researchers use BLAST (basic local alignment search tool), by NCBI (National Center for Biotechnology Information), to compare nucleotide or protein sequences to sequence databases and calculates the statistical significance of matches.
Elapsed time of a query is critical in this task. The less elapsed time of a query, the more iterations users can run during a limited time of period. That is, users would be able to achieve time-to-market goal and to save overall IT infrastructure cost.
Objective
In this article, we will show you how to run BLAST on Azure. And analyze the execution pattern of BLAST query runs, and further to find out the performance bottleneck. We will then come up performance tuning suggestions and verify their improvement. Besides that, we will examine some related topics, including multi-threading scalability, degradation of performance with multiple queries, and cost-effective analysis.
We will examine 2 kinds of different BLAST scenarios in order. Both using the most current version of BLAST (2.11.0) and “blastn” query to compare nucleotide-nucleotide sequence.
- First, is to run standalone BLAST with a large BLAST DB (~1.2TB) and very simple input file and query.
- Second, is to run Docker BLAST with a small size of BLAST DB (~122GB) and much complicated input files and query strings.
Running standalone BLAST with large BLAST DB and a simple query
- Database: Pre-formatted BLAST nucleotide collection database (~1.2TB).
- Input file: Single sequence containing 491 Covid-19 nucleotides.
- Query string: “blastn -query test.fa -db BLASTDB_1234 -out test”$RANDOM”.tabular -num_threads 30”
Please note that we are using “-num_threads 30” to utilize 30 CPUs/cores.
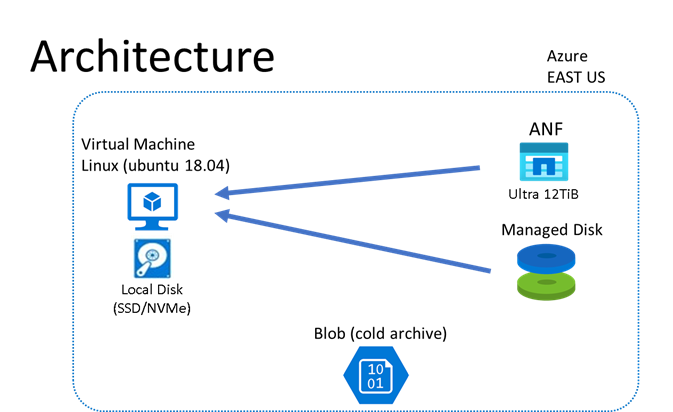
BLAST is installed standalone on one Virtual Machine. Same query will be run multiple times to compare the query elapsed time. BLAST DB and input/output files are stored in different storage locations, including Local/NVMe disks, Azure NetApp Files, and Managed (Premium) Disks. All the storage solutions provide similar IOPS and throughput capabilities.
NOTE: you can follow the step-by-step process on azurehpc/apps/blast at master · Azure/azurehpc (github.com) to create Azure environment, install BLAST, and run the test on your own.
Observations
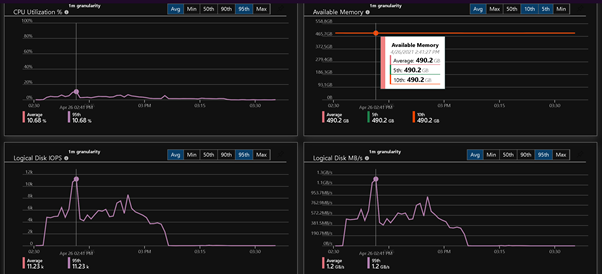
Below the screenshots of Azure Insights running BLAST on E64dsv4 VM, with both BLAST DB and input/output files stored in Local Temp SSD Disks. You can see there are 2 patterns of phases during the execution.
1st phase: It takes ~50% of the total execution time (left-hand part of the below screenshot). Very high (up to ~12K) READ IOPS with ~1.3GB/s throughput in disk I/O., and CPU utilization is only 5%~30%.
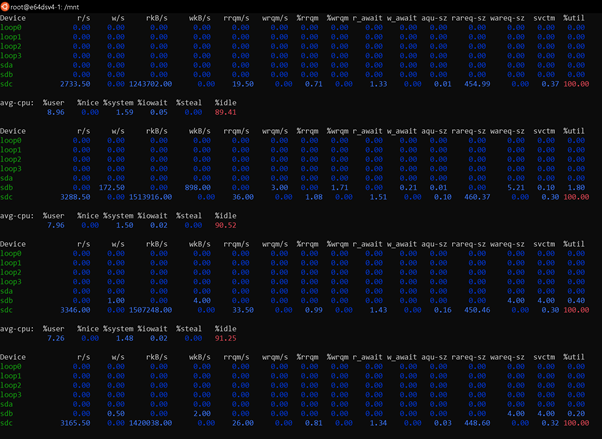
Seems for this phase it’s IO-bound. To further verify, we run “iostate” to check real-time Disk IO:
$ iostate -kx 2
The IO utilization (Local Temp Disk in “/sdc” in this case) is 100% most of the time with massive READ operations. Long disk queue length causes CPU not fully utilized. So, it’s clear it’s IO-bound in this phase.
We now need to dig out whether the IO-bound situation is due to the IOPS/throughput limitation or latency issue. We will verify it by storing BLAST DB and input/output files in different locations, which we will examine later.
Another question is, how to avoid or mitigate the IO bottleneck? Could it because the size of BLAST DB is too large to be loaded into VM’s memory? We will also verify it by running on a VM with larger than 1.2 TB memory later.
2nd phase: It takes another ~50% of the total run time (right-hand part of the below screenshot). Only 1 CPU is used with ~100% utilization in this phase. Very little networking, memory, and read/write operations. Which indicates this phase is CPU-bound and implies VM SKUs would be the performance differentiator.
Analyze Performance Bottleneck
As we discussed, the 1st phase of the run is IO-bound. We then performed tests on storing BLAST DB and input/output files in different storage locations, including Azure NetApp Files and Premium Disks. All provide similar IOPS and throughput.
Recall that we also sensed that the IO-bound situation might be due to VM’s memory not big enough to load the 1.2TB BLAST DB at once. Therefor we run the same query on M128dsv2 VM, which has 4TB memory, as comparison.
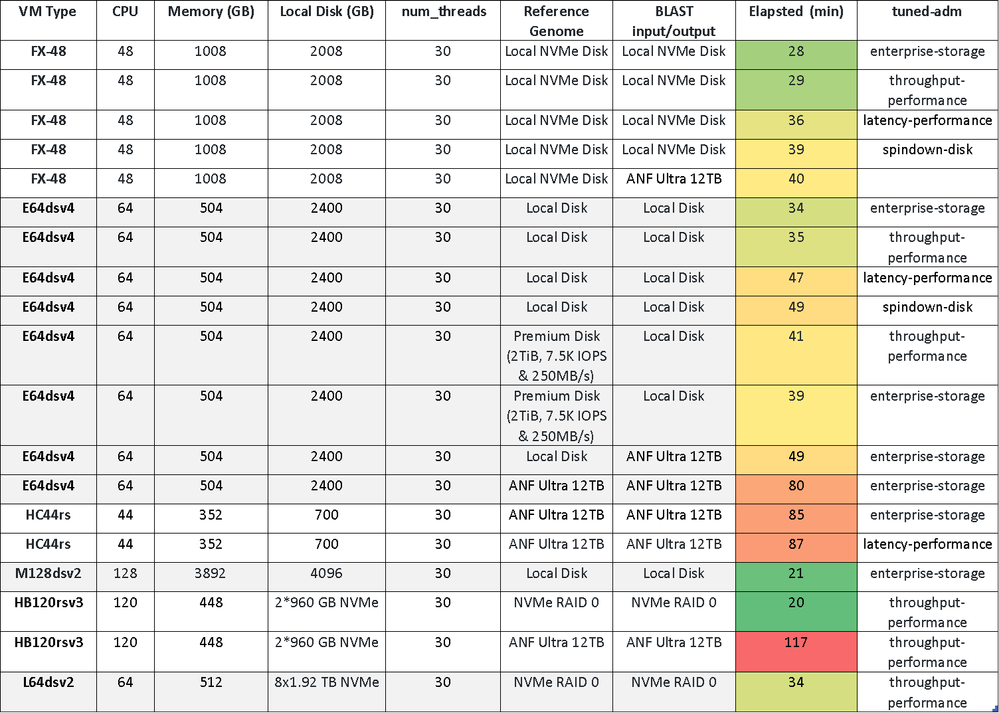
Below are the full testing results. The greener, the better of the query performance.
First, we do find M128dsv2 VM (w/ 4TB memory) perform much better than others. When running on this VM, we see very little disks IO in the 1st phase of run, and CPU utilization is nearly 100% all the time. Which validate the assumption that the IO-bound is due to VM memory size’s not large enough to load all BLAST DB. In fact, you will see the same pattern on a small BLAST size scenario later.
Second, for VMs like E64dsv4, HB120rsv3 or FX-48 (currently in private preview), having both BLAST DB and input/output files in Local Temp or NVMe Disk can provide the best performance, which indicates that the IO is very latency sensitive.
Performance Tuning
We also noticed that applying proper VM tuning profile can further optimize the performance. The “enterprise-storage” or “throughput-performance” provide slightly better than others. Below the commands you can practice on your own.
# check active tuned-adm profile
$ sudo tuned-adm active
# apply tuning profile
$ sudo tuned-adm profile throughput-performance
$ sudo tuned-adm profile enterprise-storage
Finally, VM SKUs matters the most when considering performance:
HB120v3 = M128dsv2 > FX48 > E64dsv4 > HC44rs > L64dsv2
Cost Effective Analysis
Now considering the cost. As HB120v3 is much cheaper than others, it’s also the most cost effective.
Degradation of performance with multiple queries, and CentOS vs. Ubuntu
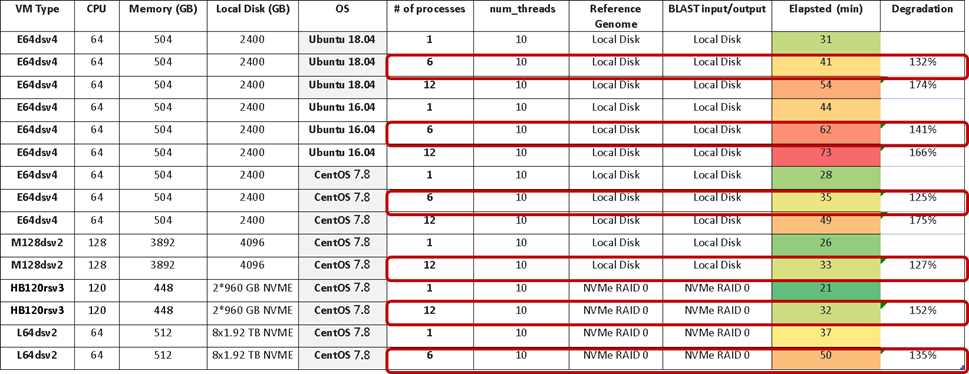
To find out if there’s any outstanding performance degradation when running multiple queries. We first run 10-threads-job and record the elapsed time as baseline. And then we run multiple (6 or 12, based on # of CPU of the VM) queries at the same time and also record the end-to-end elapsed time as shown in below table. The total elapsed time increase ~130%, as shown in red rectangle.
We also see that CentOS runs faster than Ubuntu.
Now let’s move on to examine next BLAST dataset.
Running Docker BLAST with a small size of BLAST DB and much complicated query strings
NCBI perform a BLAST analysis similar to the approach described in this publication to compare de novo aligned contigs from bacterial 16S-23S sequencing against the nucleotide collection (nt) database, using the latest version of the BLAST+ Docker image.
- Database: Pre-formatted BLAST nucleotide collection database (nt): ~122 GB
- Input file: 28 samples (multi-FASTA files) containing de novo aligned contigs from the publication.
- Query string: “blastn -query /blast/queries/query1.fa -db nt -num_threads 16 –out /blast/results/blastn.query1.out”
Please note that we are using “-num_threads 16” to utilize 16 CPUs/cores.
We tested 3 different queries, from the simplest (Analysis 1) to the complicated (Analysis 3):
NOTE: you can follow process on ncbi/blast_plus_docs (github.com) to run the same test on your own.
Observations
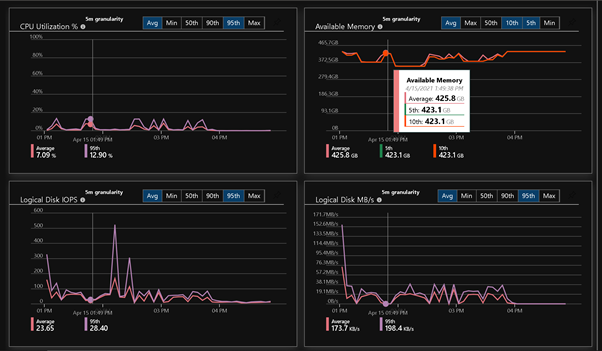
Below the Azure Insights screenshots when running the BLAST queries on HB120v3 VM, which has 120 cores of CPU. Again, there are 2 patterns of phases during the execution like what we found in previous test.
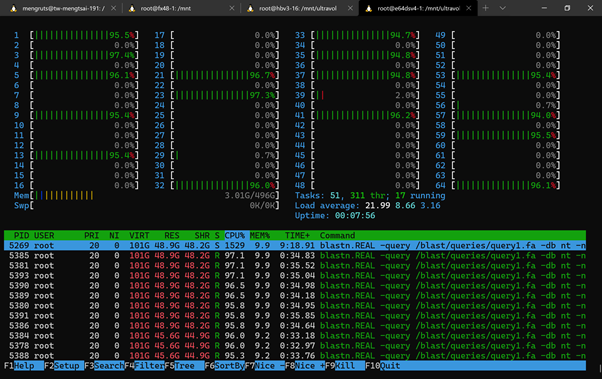
- 16 CPUs and 1 CPU are utilized in 1st phase 2nd phase, respectively. And all those CPUs are running ~100% utilization all the time during the execution, which indicate it’s a fully CPU-bound task, and no significant performance blocker on IO nor network.
- On 2nd phase, additional ~100 GB memory are used, which indicates BLAST loads the database into memory.
- Very little usage on Disk I/O and networking during the whole execution of the run.
16 CPUs ~100% usage in 1st phase ("htop" screenshot):
Very little I/O & networking usage during the whole run (Azure Insights screnthos):
Performance Tuning
Based on the observations, we found that when VM’s memory size is larger than BLAST DB (~122GB). The program loads the database into memory and doing query algorithm for all subsequent sequences. Along with the fact that CPU are fully utilized, selection of VM SKUs would play bigger role as performance differentiator.
We also tested several performance tuning practices including:
- “sudo systemctl enable --now tuned && sudo tuned-adm”
- ANF mount option to include: “nconnect=16,nocto,actimeo=600”
- Process pinning (HC44rs: “numactl --cpuset-cpus 0-15”)
Below the testing results on different VM SKUs. The greener, the better of the query performance.
As you see that:
- VM SKUs play the biggest performance differentiator in this case as we expected, and the order is the same as in previous scenario:
HB120v3 > FX48 > E64dsv4 > HC44rs
- There is minor or no impact on performance for any kind of tuning, including “tuned-adm”, mount options, or Process pinning.
Scalability
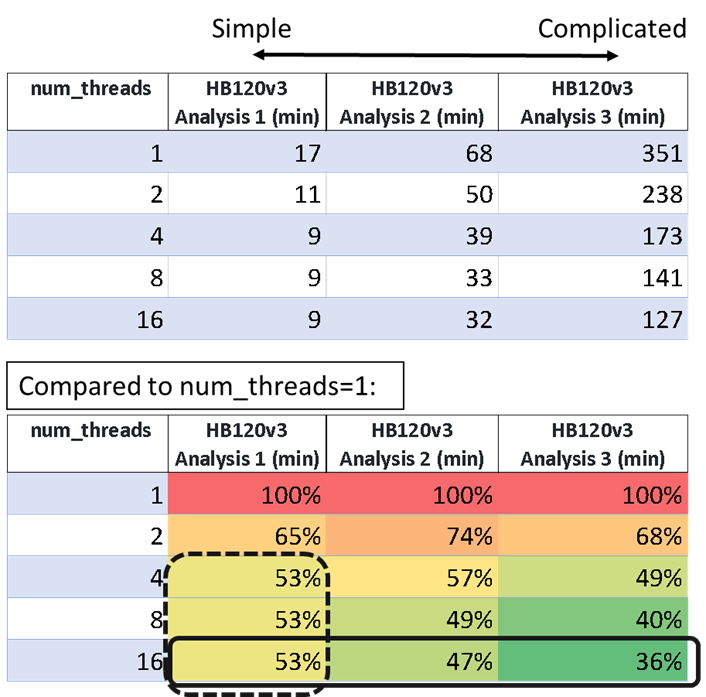
One of the promises of public cloud is scalability. So, we examine how is the level of complexity of query strings impact scalability. Below the results of elapsed time (mins) when we run 3 different kinds of query strings (Analysis 1, Analysis 2, & Analysis 3) on the same VM, with different “num_threads(=1, 2, 4, 8, & 16)” specified.
Findings:
- The more complicated of the query, the better performance gain when # of threads increase. (The concrete-line rectangle)
- With simple query, only needs small # of threads to maximize performance. (The dot-line rectangle)
Summary
Now we have walked you through the process to analyze the pattern of 2 kinds of BLAST query scenarios, and how to determine performance bottleneck. We also suggest several performance tuning practices and verify their effectiveness.
We also covered many other related topics like multi-threading scalability, degradation of performance with multiple queries, and cost-effective analysis.
Below the key suggestions when running BLAST queries on Azure.
- In overall, VM SKUs play a critical role on performance. Considering both performance and cost effectiveness.
HB120v3 >> FX48(cost TBD) > E64dsv4 > L64ds2 > HC44rs
- BLAST DB size matters.
- When BLAST DB size is larger than VM memory (left-hand side), massive READ IOPS is expected. You can consider storing both BLAST DB and input/output files on Local Temp or NVMe disk for best query performance. Of course, you will need to also consider files transfer efforts and working flow in production for best productivity.
- When BLAST DB size is smaller than VM memory (right-hand side). The whole DB will be loaded into memory. It becomes CPU-bound and VM SKUs matters the most. Many tuning options like “tuned-adm”, mount options, or Process pinning all provide very little improvement.
- The more complicated of the BLAST query, the better performance gain when # of threads increase.
- CentOS performs better than Ubuntu.
Published on:
Learn moreRelated posts
Microsoft Purview: Data Lifecycle Management- Azure PST Import
Azure PST Import enables Microsoft 365 admins to import PST files from Azure Blob Storage into Exchange Online mailboxes using PowerShell. The...
April Patches for Azure DevOps Server
We are releasing patches for our self‑hosted product, Azure DevOps Server. We strongly recommend that all customers remain on the latest, most...
Integration Testing Azure Functions with Reqnroll and C#, Part 5 - Using Corvus.Testing.ReqnRoll in a build pipeline
If you use Azure Functions on a regular basis, you'll likely have grappled with the challenge of testing them. In the final post in this serie...
Integration Testing Azure Functions with Reqnroll and C#, Part 4 - Controlling your functions with additional configuration
If you use Azure Functions on a regular basis, you'll likely have grappled with the challenge of testing them. In the fourth of this series of...
Integration Testing Azure Functions with Reqnroll and C#, Part 3 - Using hooks to start Functions
If you use Azure Functions on a regular basis, you'll likely have grappled with the challenge of testing them. In the third of a series of pos...
Integration Testing Azure Functions with Reqnroll and C#, Part 2 - Using step bindings to start Functions
If you use Azure Functions on a regular basis, you'll likely have grappled with the challenge of testing them. In the second of a series of po...

