
Azure Maps Routing Take two!
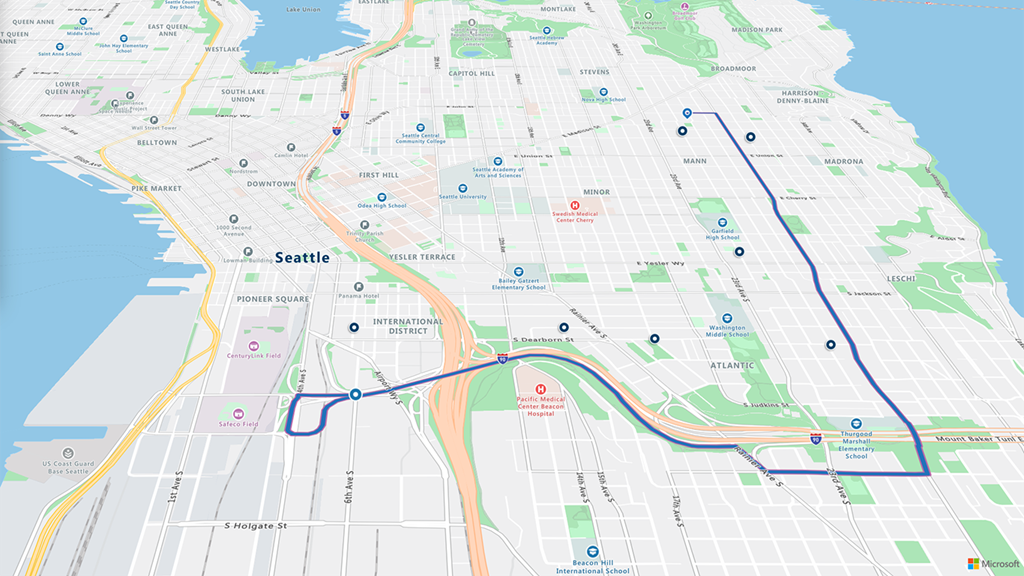
Our previous Routing blog was so popular we thought we would follow up with more great routing scenarios that you can use in your solutions by just adding Azure Maps to your Azure Subscription ( Overview for Microsoft Azure Maps | Microsoft Docs )
Here are some more routing samples to guide you how you might add these features to your scenario:
|
|
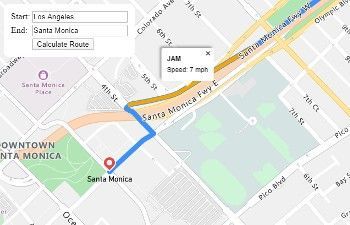
Add traffic along your route:
Although the traffic is considered when you use the route API (unless you deactivate it) with this option you can visualize how the traffic is in the route.
|
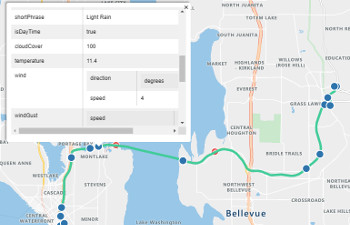
Add weather along your route:
Weather conditions can affect your drive, with the weather service APIs, powered by Accuweather, provided through Azure Maps you can check out the weather conditions along your expected route.
|
|
|

|
Get a route based on your vehicle type :
There are multiple factors to consider when we need to calculate the route for a truck rather than a car; width, height, length, weight and load are some of the options you can setup to calculate this route. Our sample shows you the difference between a truck and a car’s route based on such factors.
|
Optimize waypoints to get a better route:
If you need to find out the shortest distance for a route of multiple points this option provides you what you need, in this sample you can find 7 addresses for a total of 138.85 km shortened to 92.36 km.
|

|
To see more great examples of how Azure Maps Routes can be used in so many more ways that you expected, Check out Azure Maps Web SDK Samples (azuremapscodesamples.azurewebsites.net)
Tutorial: Web SDK Tutorials - Search for a location and more
Links:
- Microsoft Azure maps Product page: Azure Maps – Geospatial Services APIs | Microsoft Azure
- Documentation: Azure Maps Documentation | Microsoft Docs
- Web Control Documentation: Getting started with Microsoft Azure Maps web map control | Microsoft Docs
- Web Control Samples: https://azuremapscodesamples.azurewebsites.net/
Thank you for checking out Azure Maps Route APIs. All of the samples above are directly accessible through the links and have Github repositories for you to leverage the sample code within your solutions. If you need any assistance or have any questions feel free to post them in our Q&A section, we are here to help!
Published on:
Learn moreWe can help you with Azure Maps Routing Take two!
If you want help implementing, troubleshooting, or improving this product, contact us and we’ll point you in the right direction.
Related posts
Introducing the Data-Bound Reference Layer in Azure Maps Visual for Power BI
Imagine managing a nationwide sales team and needing to understand how your sales align with factors like population density, competitor locat...
Enhance Azure Maps with Overture Maps Data using PMTiles!
Supercharge Azure Maps with Overture Maps Data using PMTiles! We’ve got some exciting news. Azure Maps now supports PMTiles! This me...
Where do I go if I have questions about Azure Maps?
As you might expect, just looking around on your own, or asking Co-pilot, you can find comprehensive help like Samples.AzureMaps.com, wit...
Tailor your Reference Layers in Azure Maps Visual for Power BI
We’re excited to share the latest enhancements to the Azure Maps visual in Power BI, designed to make your data visualization even mor...
Enhancing Logistics with Azure Maps and NVIDIA cuOpt for Multi-Itinerary Optimization
The logistics industry is always finding ways to optimize vehicle routing to enhance efficiency. The Vehicle Routing Problem (VRP) and Pickup ...
Introducing the Unified Azure Maps Experience
Microsoft has recently announced the unification of Bing Maps for Enterprise (BME) with Azure Maps, marking a remarkable advancement in their ...
Power BI Azure Maps Visual: Enhanced Reference Layer & Embedded Support
The Power BI Azure Maps visual has received a major update which includes an expansion of the reference layer and the addition of Power BI Emb...
Enhance your indoor maps with real-time map feature styling
The ability to dynamically update and visualize the state of rooms or areas within a building is critical to understanding the status of any b...
Dynamic Clustering Aggregation with Custom Styling in Bubble Layer
The Power BI Azure Maps visual allows you to create stunning geospatial visualizations with your data. Today, we are excited to announce a new...
HO HO HO Two Point OH!
You might notice some big changes have come to the North Pole experience at NORADSanta.ORG this year. Developer elves have implemented a...