Get insights about Power Apps usage with Microsoft Clarity PCF code component

Getting insights on user behavior in Power Apps canvas apps can be in various ways - for instance, you can analyze app telemetry with Azure Application Insights and trace events. If you are more interested in visual heatmaps and session recordings, you might already have had a look at Microsoft Clarity, which exactly provides that:
What is Microsoft Clarity and how do I connect it to a Power Apps canvas app?
Clarity is a user behavior analytics tool that helps you understand how users are interacting with a website through features such as session replays and heatmaps.
It is installed by adding a tracking code into the <head> section of the website.
As a Power Apps canvas app running in the browser is also still just a website, we only need to find a way on how to inject the Clarity JavaScript script into the head of our canvas app.
Unfortunately, there is no connector for Microsoft Clarity, but we can leverage the Power Apps component framework for that.
Power Apps component framework to the rescue
With Power Apps component framework we can create code components for Power Apps. I created a code component for Microsoft Clarity, so that we can use Clarity in our canvas apps.
High level overview
To give you an idea on how to create this, here is high level overview- it’s not meant to replace extensive learning with very detailed step-by-step instructions though. I will link to resources though if this is your first code component - it was my first :-)
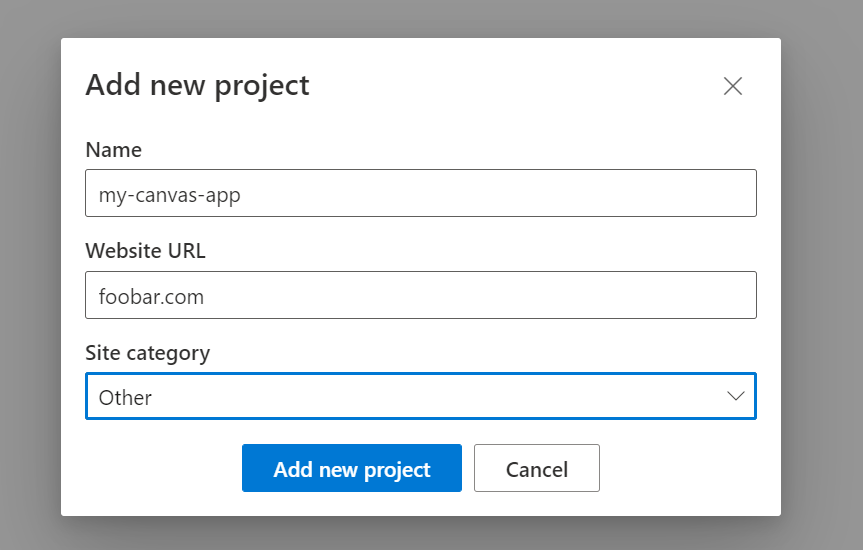
- Sign up for a free Clarity account
- Set up your project
- Use Power Platform CLI to create the code component
- In the scaffolded project, locate
ControlManifest.Input.xmlandindex.ts - Update the
ControlManifest.Input.xmlfile to
<?xml version="1.0" encoding="utf-8" ?>
<manifest>
<control namespace="ClarityNameSpace" constructor="ClarityCodeSnippet" version="1.0.0" display-name-key="ClarityLovesPowerApps" description-key="Clarity Code Component to analyze user behavior" control-type="standard" >
<property name="YourClarityProjectID" display-name-key="<your-clarity-project-id>" description-key="description" of-type="SingleLine.Text" usage="bound" required="true" />
<external-service-usage enabled="false">
</external-service-usage>
<resources>
<code path="index.ts" order="1"/>
</resources>
</control>
</manifest>
- In the index.ts file, we first need a
private _Container: HTMLDivElement;above the constructor - then add the following code to the
init method
 public init(context: ComponentFramework.Context<IInputs>, notifyOutputChanged: () => void, state: ComponentFramework.Dictionary, container:HTMLDivElement): void
{
const head = document.getElementsByTagName('head')[0];
const script = document.createElement('script');
script.innerHTML = '(function(c,l,a,r,i,t,y){c[a]=c[a]||function(){(c[a].q=c[a].q||[]).push(arguments)};t=l.createElement(r);t.async=1;t.src="https://www.clarity.ms/tag/"+i;y=l.getElementsByTagName(r)[0];y.parentNode.insertBefore(t,y);})(window, document, "clarity", "script", "<your clarity project id>");'
head.insertBefore(script, head.firstChild);
const textDiv = "<div>We are tracking this app with Microsoft clarity, have a lovely day!</div>"
this._Container = document.createElement("div");
this._Container.id = "ClarityDivID";
this._Container.innerHTML = textDiv;
container.appendChild(this._Container);
}
- Packageand Build your component
- Import your code component solution
- Add your code component into a Canvas App
- Don’t forget to (re-) publish your app ;-)
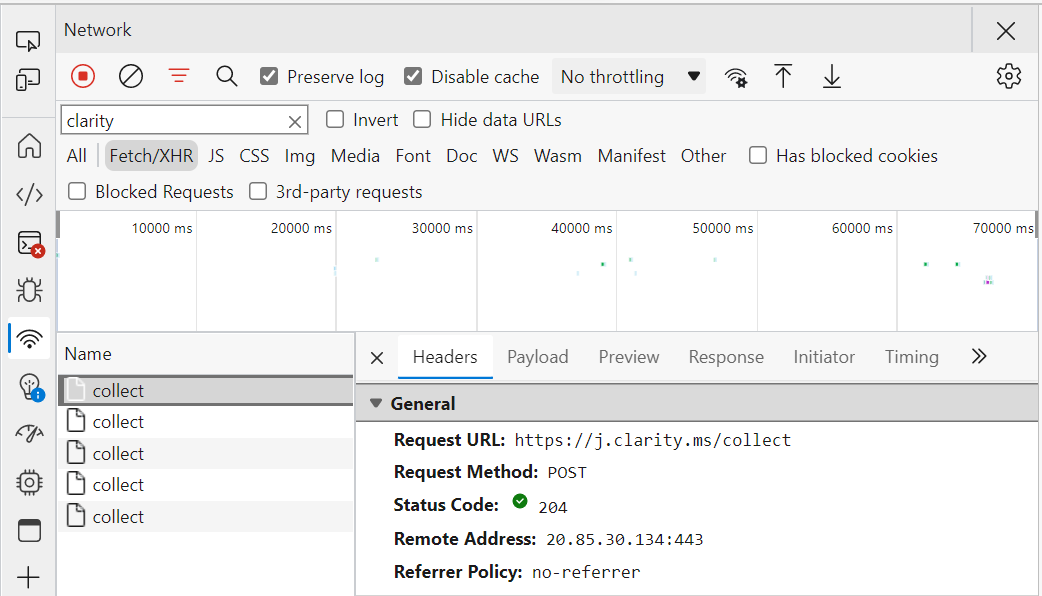
When you now use the app, you can open Edge Dev tools on the Network tab and see the work Clarity is doing:
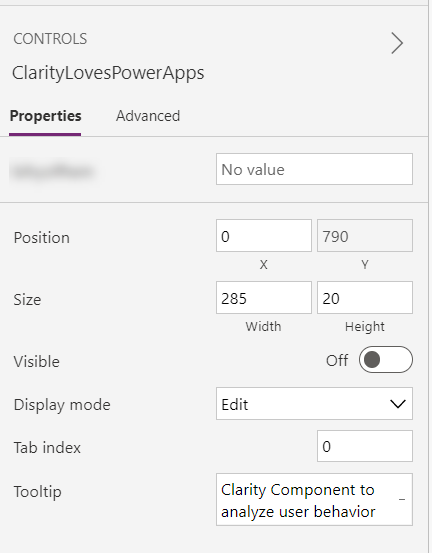
How does this now look like in our Canvas app?
In your Canvas app, you can either style your code component or you can set the Visible property to false to hide it.
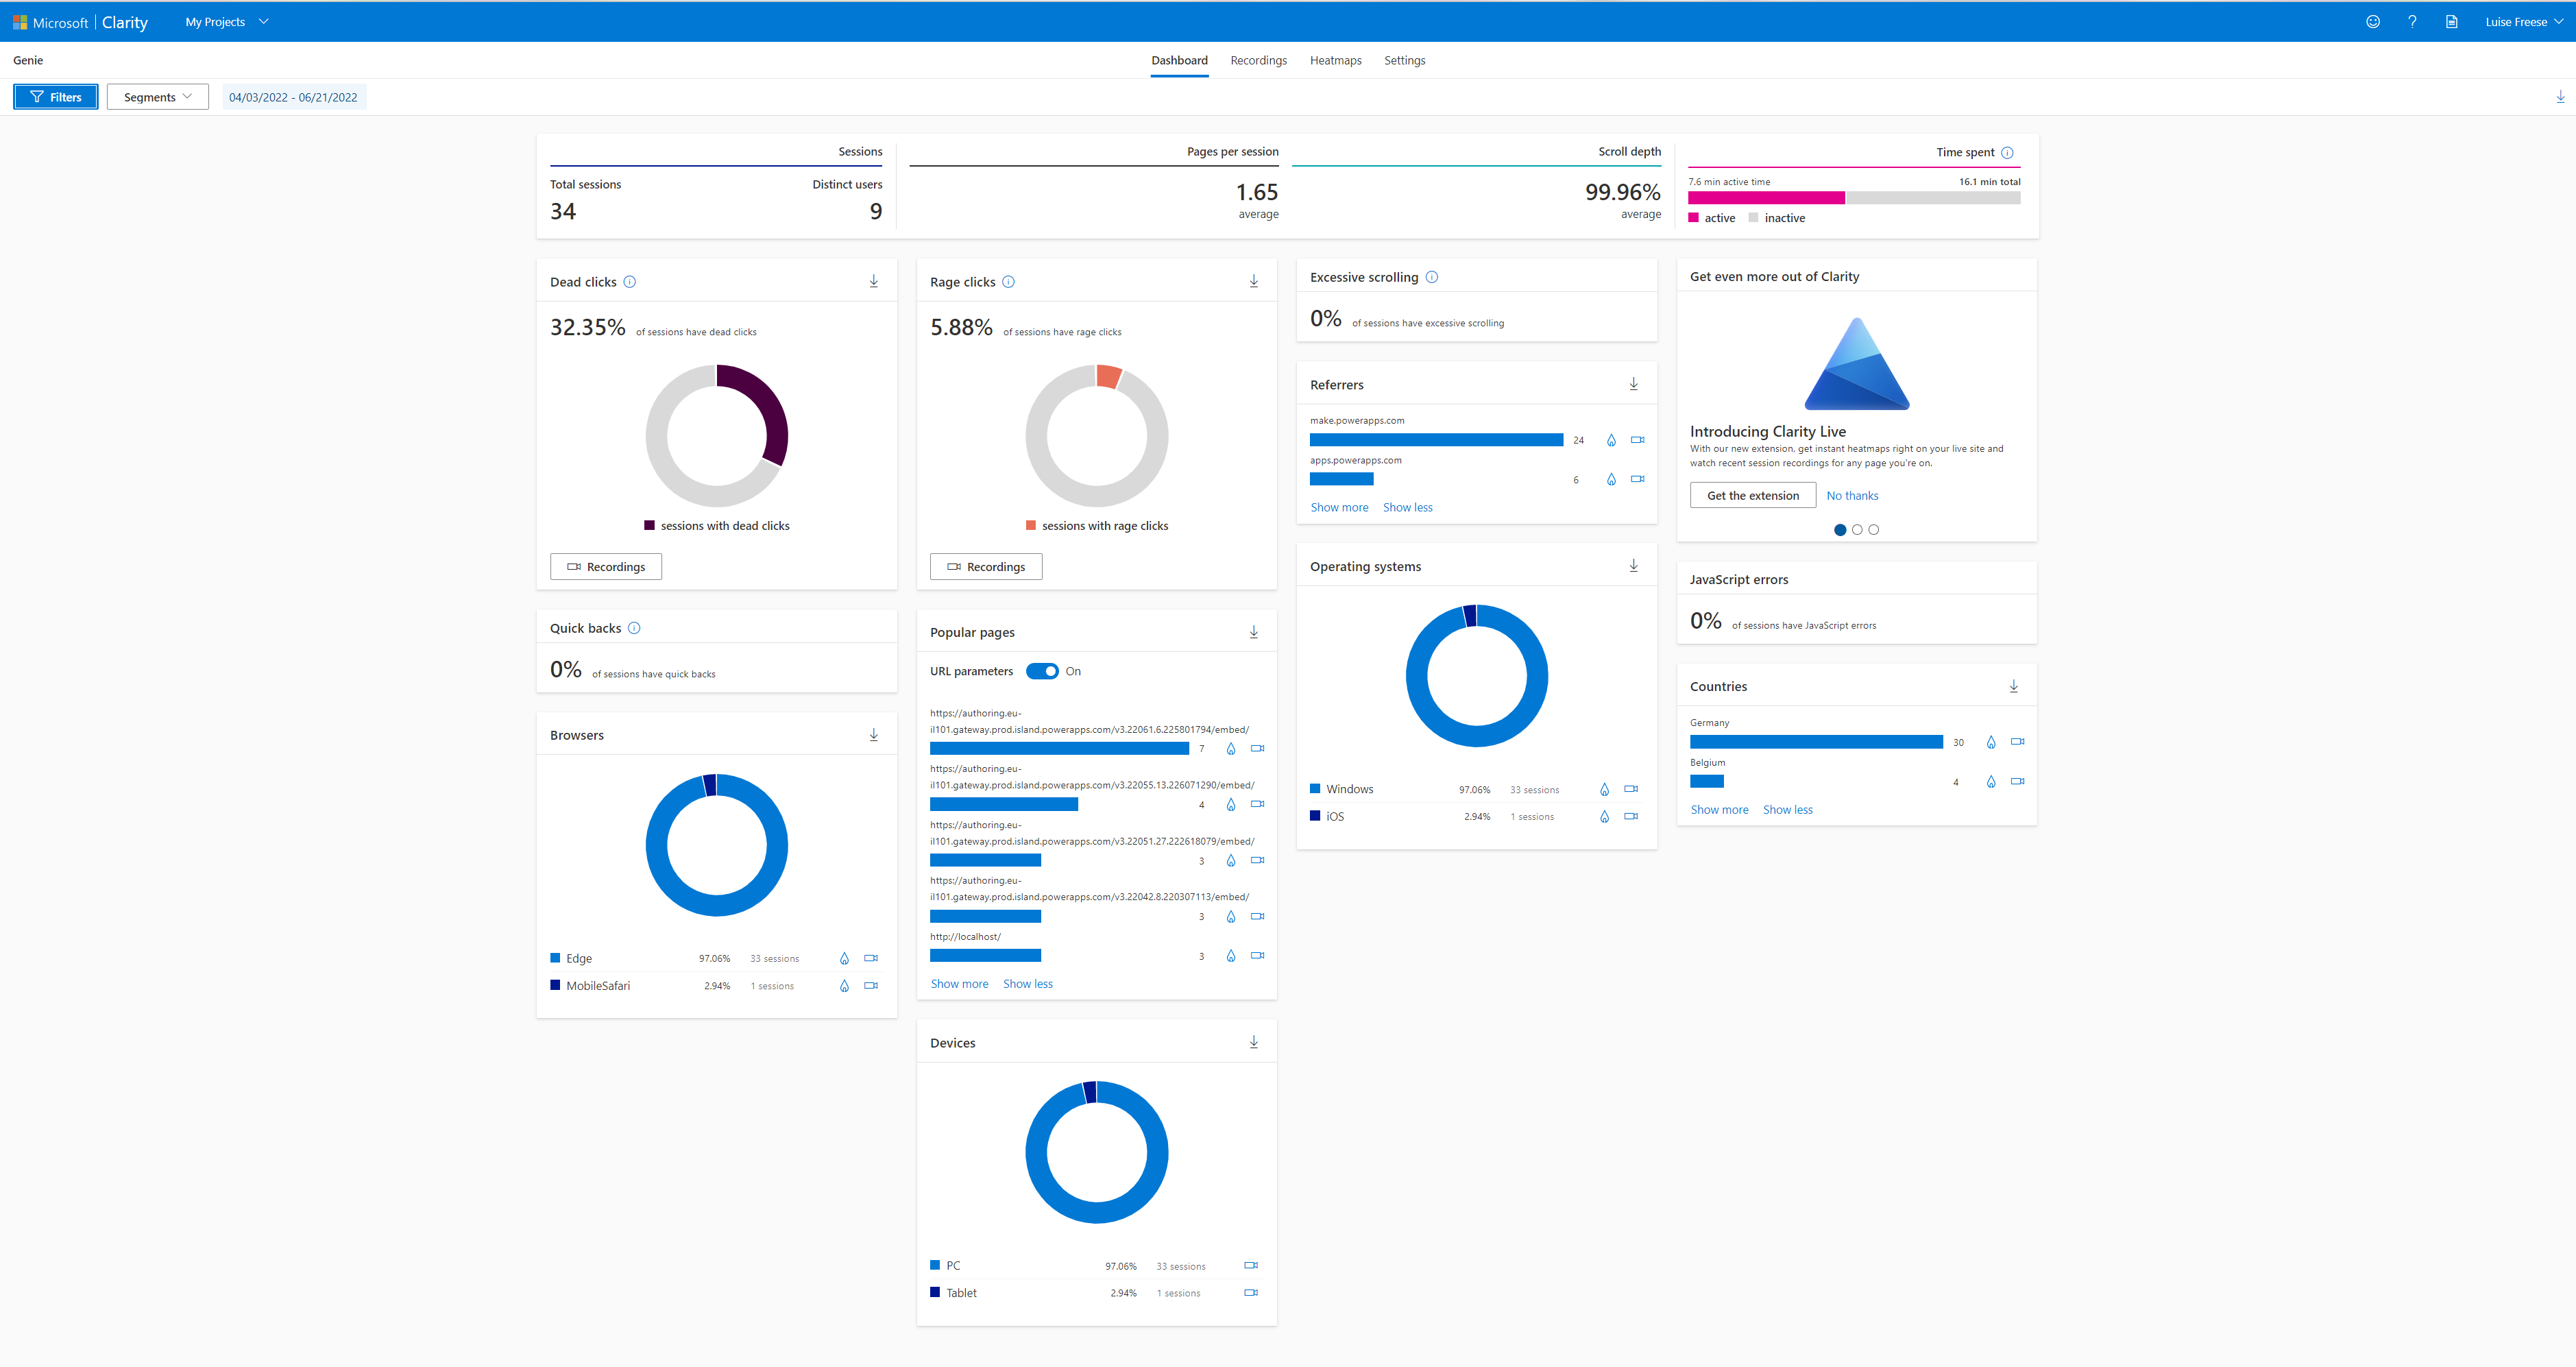
It takes a decent while (I guess about 90 minutes) for data to arrive for the first time in Clarity, but after that it runs smoothly - here is how the dashboard then looks like:
If we now want get more into the details of users are interacting with our apps (sometimes easier than asking them), we can watch a replay of the session recordings:
This gives us information on where users click, scroll and type.
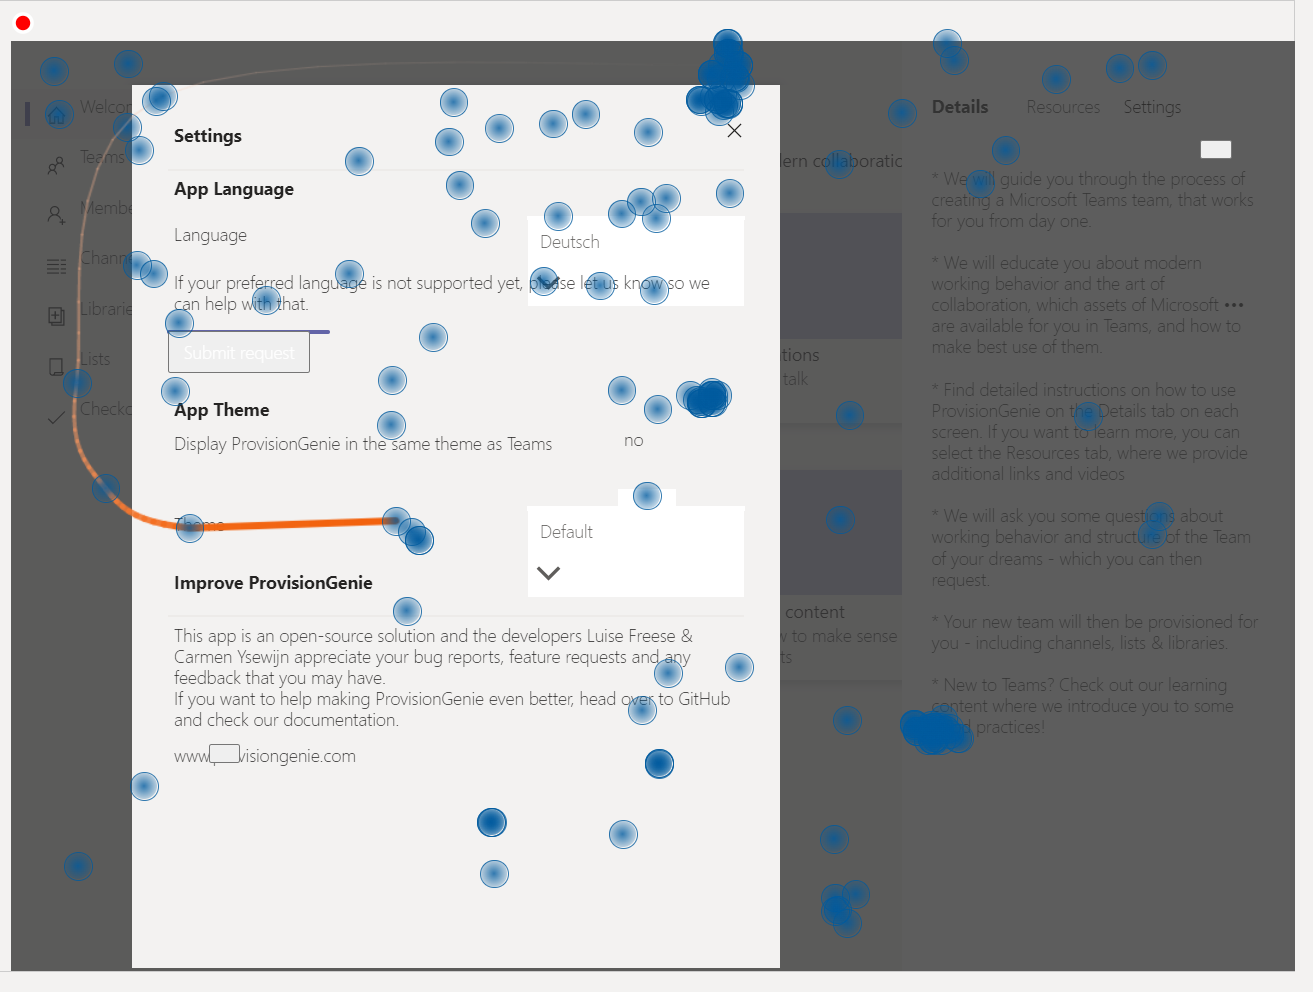
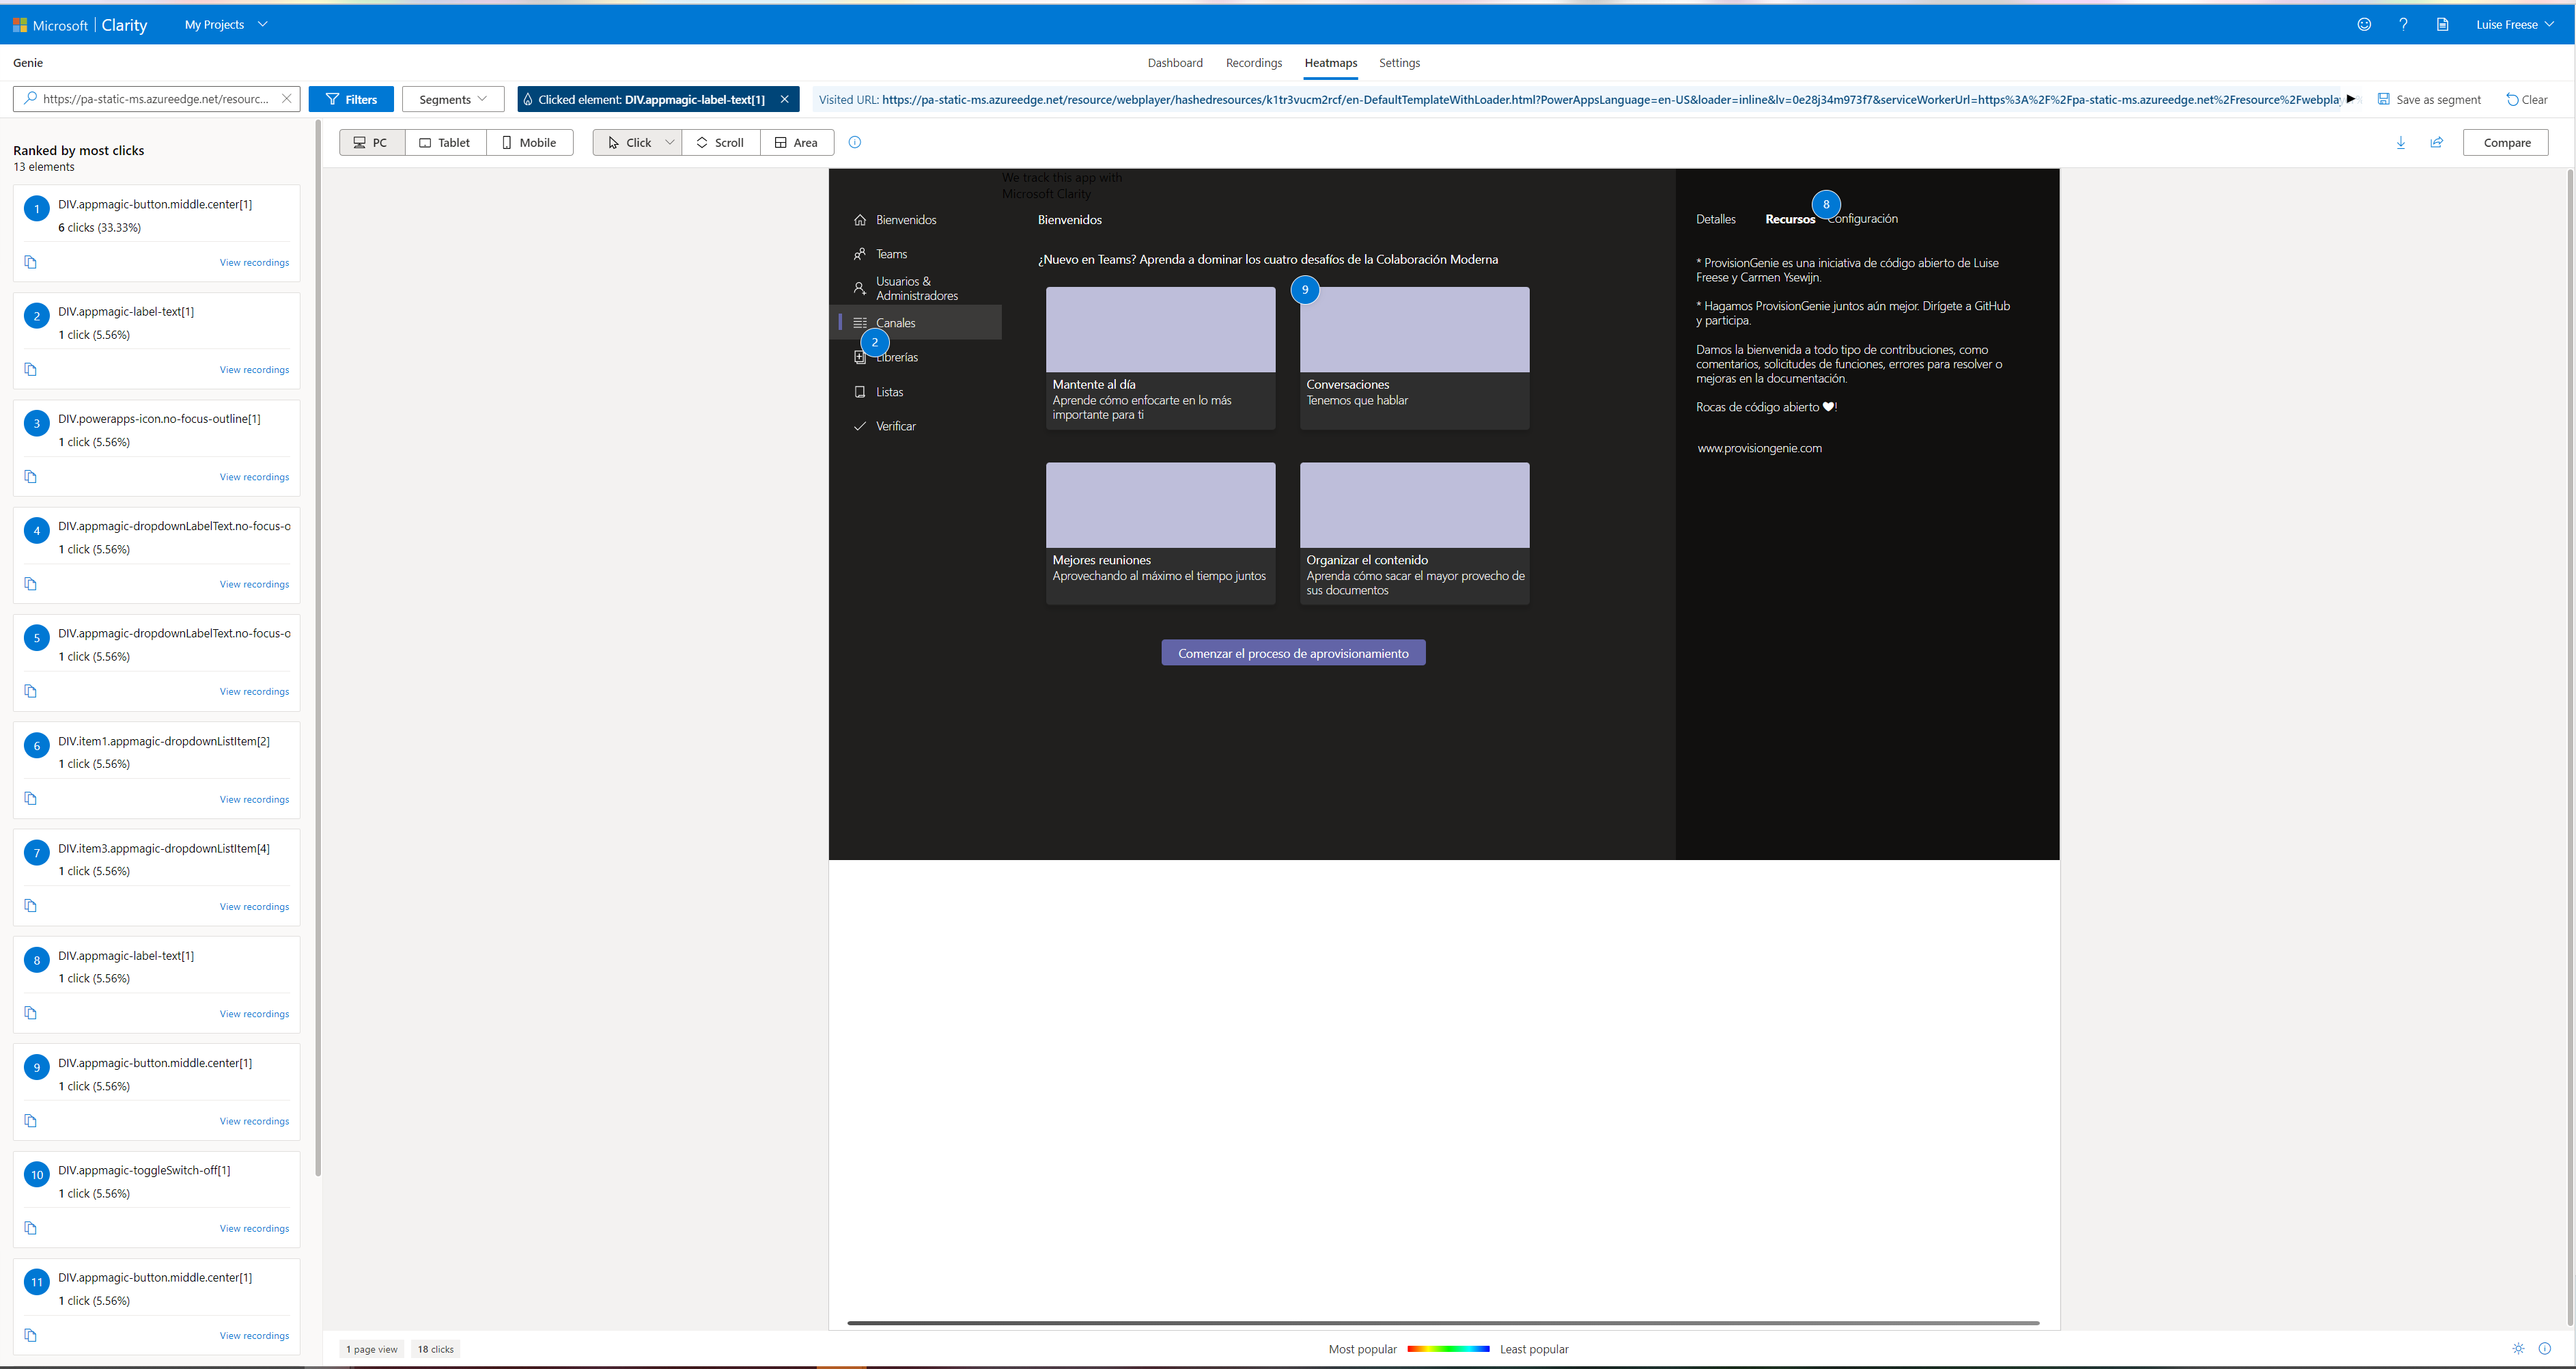
Heatmaps are a valuable feature to determine which parts of an app are most selected:
Where to find the component
You can find this component on my GitHub - Let me know if you have questions! If you found this blog post useful, please also subscribe to my newsletter - news coming about every 2 months, I promise to not spam you!
Published on:
Learn moreRelated posts
Transforming Procurement with Microsoft Power Apps: From Manual Processes to Intelligent Operations
Microsoft Power Apps enables organizations to build tailored procurement applications without extensive custom development. By creating a cent...
Top 25 Real-World Power Apps Projects Every Fresher Should Build Before Applying for Jobs
Introduction One of the biggest mistakes fresh graduates make while preparing for Microsoft Power Platform Developer interviews is focusing on...
Offline-First Canvas Apps Grow Up: Real-Time Dataverse Access Arrives
A field technician I shadowed on a project once put it perfectly: "The app works great in the parking lot and dies in the basement — and...
Did You Know | Power Apps Code Apps have a new CLI (power-apps) that replaces ‘pac code’
If you have been building Power Apps Code Apps with the pac code commands, there is a new CLI you should know about. The power-apps npm CLI is...
Power Apps Code Apps | power-apps authorization error | Reason and fix
In my previous post, Power Apps Code Apps – Trigger a Power Automate Flow, I walked through adding and calling a cloud flow from a code a...
How to Backup a Microsoft Power Pages (Power Apps Portals) Website
Microsoft Power Pages (formerly known as Power Apps Portals) is a low-code platform for building secure, external-facing websites that integra...
Power Apps – Entity scoping in global search
We are announcing entity scoping in global search in Power Apps. This feature will reach public preview on August 7, 2026. How does this affec...
Power Apps – Multi Select in Grid column filtering
We are announcing Multi Select in Grid column filtering in Power Apps. This feature will reach public preview on August 7, 2026. How does this...
Benefits of Microsoft Power Apps for Modern Businesses: Why Businesses Are Embracing Low-Code Development
Every business wants to work smarter, respond faster, and reduce manual effort. Yet many organizations still rely on spreadsheets, paper forms...