Highlighting Below Avg Sales per Hierarchy Level with SWITCH() and ISINSCOPE() DAX Functions in Power BI

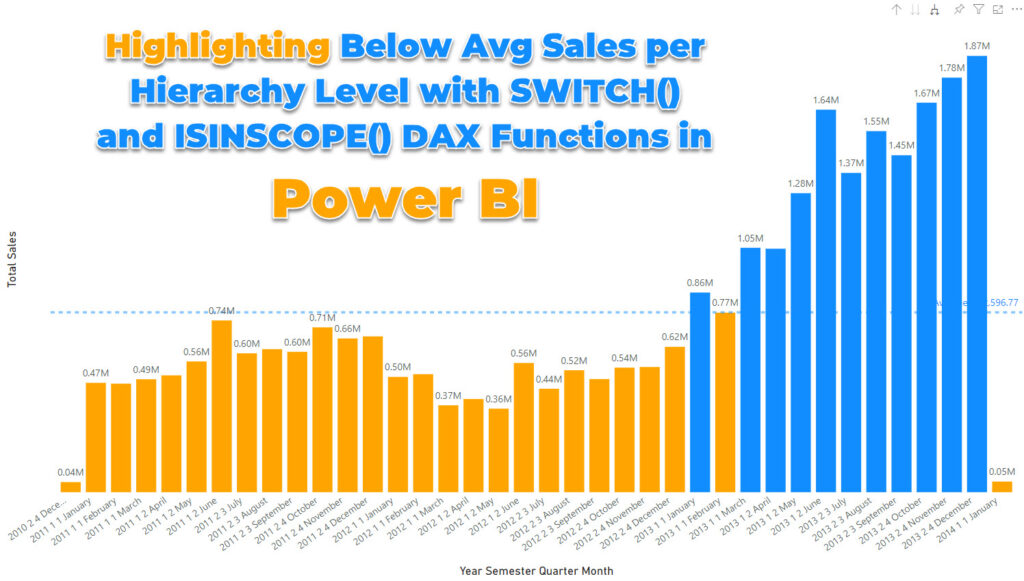
This post discusses how to use the SWITCH() and ISINSCOPE() DAX functions in Power BI to highlight below-average sales per hierarchy level. This solution was inspired by a project in which the customer had a conditional formatting requirement on a column chart that assigned conditional formatting to columns based on average values, relative to the level of hierarchy.
The scenario the post explores involves a Calendar hierarchy, and through a detailed explanation of the DAX functions and steps involved in the process, it guides the reader through building a solution to highlight sales data that falls below the average at each level of the hierarchy. Whether you're an experienced Power BI user or just starting out, this post provides valuable insights on implementing DAX functions to enhance your data visualization and analysis.
If you're interested in learning how to highlight below-average sales data per hierarchy level using SWITCH() and ISINSCOPE() functions in Power BI, this post is a must-read.
The post Highlighting Below Avg Sales per Hierarchy Level with SWITCH() and ISINSCOPE() DAX Functions in Power BI originally appeared on BI Insight.
Published on:
Learn moreRelated posts
Power BI DAX ALL Function – How It Works
If you're struggling with understanding the Power BI DAX ALL function, this tutorial is here to help you out. The ALL function can be a bit co...
RANKX Deep Dive: A Power BI DAX Function
If you're looking to take your Power BI skills to the next level, then RANKX is a function worth exploring. This scalar DAX function enables y...
Master Time Intelligence In Power BI Using DAX Functions
In this tutorial, the focus is on the combination of DAX functions that can be used for time intelligence calculations. This type of calculati...
Enhancing Column chart for Variance Analysis in Power BI: A Step-by-Step Guide
For businesses, tracking and comparing sales or profit variances across different categories or countries is crucial for informed decision mak...
The Most Powerful Function Call In Power BI
If you're looking to take your data visualization and analysis to the next level with Power BI, you'll want to explore the most powerful funct...
Power BI DAX Tip : Demystifying INDEX Function
In this video, you will learn about the INDEX function in Power BI DAX and how it can be used to retrieve values from a table or data matrix. ...
DAX CALCULATETABLE Vs FILTER Function
DAX Studio provides both the CALCULATETABLE and FILTER functions for data manipulation and analysis. In this tutorial, we'll delve into the di...
What is PARALLELPERIOD () DAX function? How to use it? | DAX Sundays | BI Consulting Pro |Power BI
This video from BI Consulting Pro is a helpful guide to understanding and using the PARALLELPERIOD() function in DAX. As someone working with ...
PATH Function in Power BI DAX Tutorial (41/50)
Get ready to dive deeper into Power BI DAX with this tutorial on the PATH function. In this video, you'll learn about parent and child hierarc...