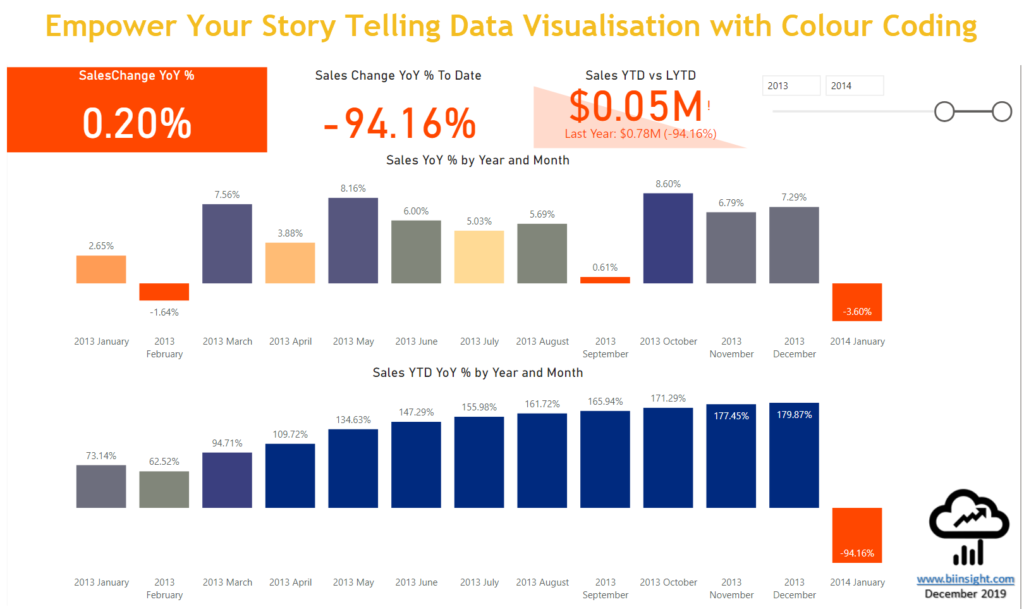
Empower Your Story Telling Data Visualisation in Power BI with Colour Coding

If you're looking to take your data visualization game to the next level, color coding is a crucial tool in your arsenal. It's a highly powerful and efficient way to convey information without overwhelming your audience. This post delves into the critical role that color coding plays in effective data visualization.
Through Power BI, you can use color coding to bring data to life, highlight trends, and communicate insights at a glance. With the tips and techniques outlined in this post, you'll learn how to leverage color coding to craft compelling stories that resonate with your audience.
Overall, this post serves as a valuable resource for anyone seeking to create data visualizations that are not only informative but also visually engaging. So why not empower your story telling today by integrating color coding into your Power BI projects?
The post Empower Your Story Telling Data Visualisation in Power BI with Colour Coding appeared first on BI Insight.
Published on:
Learn moreRelated posts
Power BI Shape Map Visualization For Spatial Analysis
The Shape Map Visualization is one of the most versatile tools available for spatial analysis in Power BI, and this tutorial provides a compre...
Power BI Introduction Power BI Desktop | Power BI Service | Power Query | Data Modelling Data Visualization | Power BI Mobile Data Connectivity
Microsoft Power BI is a powerful and popular business intelligence and data visualization tool or suite developed by Microsoft. It enables use...
Data Visualization Technique in Power BI – Multi Measure Dynamic Visuals
In this blog post, you'll discover a powerful data visualization technique that will take your Power BI analysis to the next level — the...
Advanced Geospatial Data Visualization Techniques | Benefits Explored
In this article, the focus is on the benefits of advanced data visualization techniques as data continues to become more voluminous and comple...
Best Design Practices for Power BI Dashboards | Data Visualization Tips
In this tutorial, you'll gain insights into the best practices that can aid you in designing data-driven stories for the Power BI dashboard. T...
Top 20+ Data Visualization Interview Questions Explained
If you're aiming for a career in data visualization or data analytics, interview questions can be daunting, especially given the technical nat...
Is a Lengthy Iterative Data Visualization Design Process Relevant in the Era of Generative AI?
The article discusses whether or not the traditional lengthy, iterative data visualization design process is still relevant in the era of gene...
Webinar: Enhance Dynamics 365 CRM Visualization Experience with New-Age Data Visualization Apps!
In today's business world, visual representation of data plays a crucial role in understanding complex business processes. This is where data ...
Data Driven Storytelling And Design In Action
If you're interested in mastering data-driven storytelling and visualization techniques, you're in the right place. This blog post discusses h...