Create alerts for your Synapse Dedicated SQL Pool
Author: @NickSalch is a Sr. Program Manager in the Azure Synapse Customer Success Engineering (CSE) team.
Introduction
In this article, I will discuss how to configure alerts for you Azure Synapse dedicated SQL pool and provide recommended alerts to get you started. Enabling alerts allows you to detect workload issues sooner allowing you to take action earlier to minimize end-user impact.
In Azure Synapse, alerts can be triggered by Azure Metrics data or data in Log Analytics, this post will provide examples for both scenarios. Azure Metrics provide resource-based metrics that allow you to alert when you have resource issues. Azure Log Analytics provides query-based logs that allow you to trigger on things like large operations, long-running operations, long queueing, etc. When writing alerts against Log Analytics data you can be much more creative in the types of things you alert on since anything you write a KQL query for can be turned into an alert.
Alert trigger frequency
It's very important that you only create alerts that are actionable. An alert that is triggered frequently without no action-item for the person receiving the alert will eventually be ignored. In this case they may start ignoring other, more important alerts as well. There should be clear criteria "when you see this alert, you should do this". For instance, if you get an alert for high tempdb usage, you should investigate large data movement operations to see if there is a query using too much tempdb.
High-level steps:
Creating an alert consists of 2 major steps:
- Determine the logic that triggers the alert
- Create an action group that tells the alert what to do when triggered
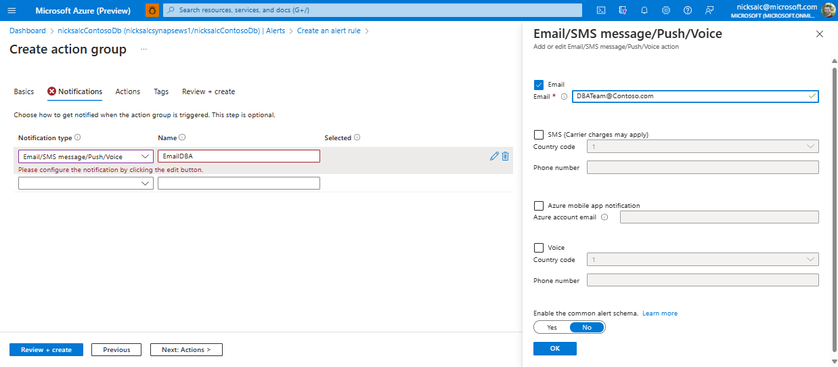
For notification alerts you can trigger an email, SMS message, Azure app notification, or phone call. You can select multiple options as well:
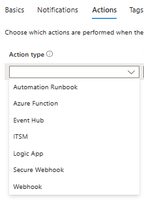
In this post we will focus on the notification-based alerts above, but you can extend these alerts to take an action if desired. If you would like to trigger an action here are the types of actions to choose from:
Creating your first alert
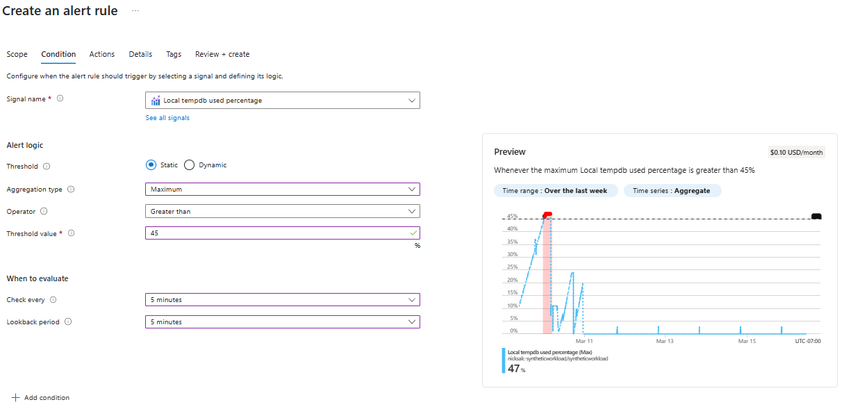
Let's walk through creating an alert so you can see the end-to-end process, then I will provide some sample alerts so you can configure some alerts to get you started. The alert we are creating is going to:
- Every 5 minutes look at the past 5 minutes of data
- Pick the maximum value out during that period
- Trigger an alert if that value is greater than 45% - you can alter this amount based on your alert history in the 'preview'
Steps:
- Navigate to your dedicated SQL Pool in the Azure Portal
- Navigate to the 'Alerts' blade on the left pane
- Select 'Create' -> 'Alert Rule'
- Select the signal - in this example we will create 'Local tempdb used percentage'. You may have to click 'see all signals' to get the full list.
- Set alert logic
- Threshold: Static
- Aggregation type: Maximum
- Operator: Greater than
- Threshold value: 45
- Set 'When to evaluate'
- Check every: 5 minutes
- Lookback period: 5 minutes
- In the 'preview' window, set the time range to 'over the last week' and evaluate if 45% is too low. If you see spikes to right around 45%, but dropping immediately after, you may want to raise this threshold to 50% or 55%.
- Select 'Next: Actions:'
- If you have not already created an action group, select 'Create Action Group'
- Give the action group a Name and click 'Next: Notifications'
- Set notification type to 'Email/SMS message/Push/Voice'
- Name this action, you may reuse this action for other alerts, so make it descriptive in the action it takes
- In the right pane that popped up (if it didn't hit the pencil icon) set the checkmark for 'Email' and enter the email of a user or group you would like to notify
- Select 'OK'
- Select 'Review + Create'
We are not setting up actions for this alert, but if you want to configure the alert to take an action, then select 'Next: Actions >' and configure an action.
-
Select 'Create'
Repeat this same process for other alerts. Below are the settings for recommended alerts for you to configure and are a good entry-point for setting up alerts on your dedicated SQL pool. You should regularly evaluate the utility of an alert as well as the thresholds to make sure they are firing at the right time and with the right frequency.
Recommended Alerts
The TempDB alerts are the most important alerts in this list and every dedicated pool should be monitoring tempdb usage. TempDB is where we store the intermediate results of data movement or spilling due to under-granting memory to a particular query. High tempdb usage may be an indicator of problem queries. I also provide a number of other alerts as well that you may implement depending on how actively you would like to monitor your system.
___________________________________________________________________________________
TempDB 50%
|
Why |
When TempDB hits around 50% it is a good indicator that there is a very large data movement happening that may need to be killed. There are many scenarios where this could happen, but one example is if a query does not have statistics and the optimizer was not able to correct the proper movement type for the amount of data it is processing. This alert is meant to identify these queries before they become a problem. |
|
User action when triggered |
DBA should log in to see if there is a query that is likely to cause a problem or if this is a normal query. If no action is needed after multiple alert triggers, consider raising the threshold for triggering the alert.
Run sp_status from the Synapse Toolkit. This will show you the overall workload and the largest data movement operations currently running and how much data they have processed.
If you do not want to install the Synapse Toolkit you can manually run the 'Data movement heavy hitters' query from the Synapse Toolbox to identify large data movement operations. |
|
Signal Name |
Local tempdb used percentage |
|
Threshold |
Static |
|
Aggregation Type |
Maximum |
|
Operator |
Greater than or equal to |
|
Threshold Value |
50 |
|
Check Every |
5 minutes |
|
Lookback period |
5 minutes |
|
Details page: severity |
Warning |
___________________________________________________________________________________
TempDB 75%
|
Why |
Like the 'TempDB 50%' alert, tempdb reaching 75% is an indicator that there is likely a problem query executing that could impact other queries. If TempDB reaches 100%, then queries that attempt to allocate objects in TempDB will fail with an error like "failed to allocated space for object tempdb…"
The data that is being monitoring for tempDB percentage is based on the average usage across all of the nodes. This means that if this shows 75-80%, but the operations running has a large amount of skew due to data quality issues then it is likely that a particular node may be close to running out of space. If one Node runs out of space and any query attempts to allocate space on that node, then you will get the same error. |
|
User action when triggered |
DBAs should react immediately. There is likely an imminent resource issue on the system.
Run sp_status from the Synapse Toolkit. This will show you the overall workload and the largest data movement operations currently running and how much data they have processed.
If you do not want to install the Synapse Toolkit you can manually run the 'Data movement heavy hitters' query from the Synapse Toolbox to identify large data movement operations. |
|
Signal Name |
Local tempdb used percentage |
|
Threshold |
Static |
|
Aggregation Type |
Maximum |
|
Operator |
Greater than or equal to |
|
Threshold Value |
75 |
|
Check Every |
5 minutes |
|
Lookback period |
5 minutes |
|
Details page: severity |
Critical |
___________________________________________________________________________________
DWU Usage near 100% for 1 hour
|
Why |
High CPU usage itself is generally not an indicator of an issue - rather it is an indicator that we are maximizing the CPU in the system to process queries as fast as possible. When this may be an indicator of a resource issue is when CPU usage pegs at 100% for a very long period of time. This is likely an indicator that there is a query performing a very CPU-intensive operation that possibly should be killed to prevent affecting other queries on the system. |
|
User action when triggered |
Use sp_status from Synapse Toolkit or run DMV queries to identify long-running operations. In the 'running query' results you will find aggregated CPU statistics for each currently running step. You may look for a query that is orders of magnitude larger than the others as an indicator it is running a CPU-Intensive operations. You can also look for steps that started around the time the spike started for an indication that it may be causing high DWU usage.
If a single query is identified it should be evaluated if that query should be killed an optimized. CPU scheduling is handled by all of the nodes in the system, so you will not receive any errors for running out of CPU, but CPU could be consumed by this query that could otherwise be used for other queries.
If a single query is not identified it may just be that the overall workload is consuming a lot of CPU, in which case there is no immediate action to take unless you want to evaluate your workload and queries to see if there are possible optimizations. |
|
Signal Name |
DWU used percentage |
|
Threshold |
Static |
|
Aggregation Type |
Average |
|
Operator |
Greater than |
|
Threshold Value |
95 |
|
Check Every |
1 hour |
|
Lookback period |
1 hour |
|
Details page: severity |
Warning |
___________________________________________________________________________________
Queued queries
|
Why |
Queueing on its own is not an indicator of a problem - we have a maximum concurrency and queries beyond that will queue, but sometimes granting more resources to running queries to complete them faster ends up with a higher overall throughput than trying to make all queries run concurrently. If you decide to implement these alerts you are looking for periods where queueing is order of magnitude higher than normal indicating something abnormal is going on with your workload that you should investigate. |
|
User action when triggered |
Use sp_status in the Synapse Toolkit to evaluate if there are running queries that are consuming an inordinate amount of resources preventing the system from maximizing throughput. |
Overall queueing
|
Signal Name |
Queued Queries |
|
Threshold |
Static |
|
Aggregation Type |
Total |
|
Operator |
Greater than or equal to |
|
Unit |
Count |
|
Threshold Value |
Varies by workload |
|
Check Every |
15 minutes |
|
Lookback period |
1 hour |
|
Details page: severity |
Warning |
Setting your threshold:
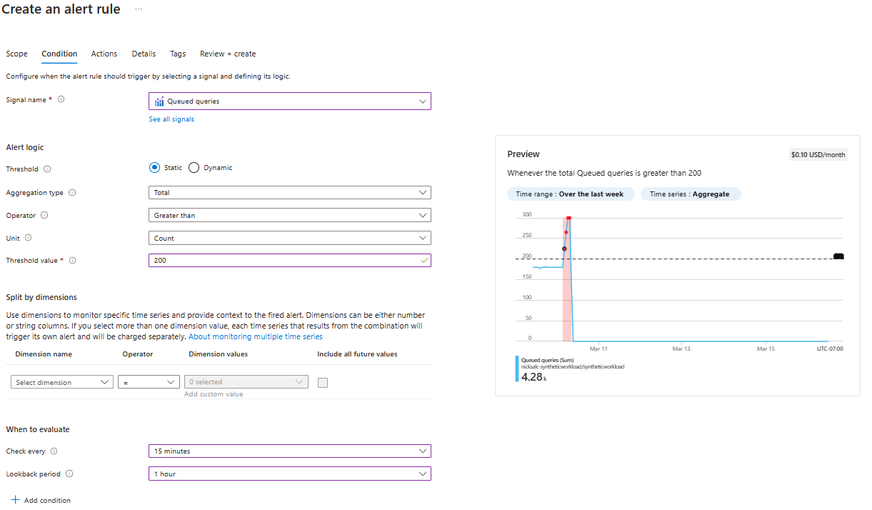
The easiest way to set your threshold values is to use the preview window on the 'Condition' page when creating the alert to determine how many times in recent history this would have been triggered. In some cases, you may want to trigger if there is a small amount of queueing like 20 queries in 15 minutes, but more likely you only want to be notified if there is a lot fo queueing indicating a system slowdown - for example 150 queued queries in 15 minutes. Your results will vary based on your workload and what normal queueing looks like.
For example, in my instance a number that will only show me the spikes, but not trigger for normal daily queueing would be 200 queries queued in 1 hour and in this example I am looking at this data every 15 minutes.
Queueing in a particular workload group
Perhaps a more useful metric of queueing is to monitor for abnormal queueing only for workload groups that you do not expect queueing. For example, if you have created a workload group for your ETL named 'wg_ETL' and you expect that this group should rarely queue behind other queries, then you could create a rule that only looks at queued query counts for 'wg_ETL'.
|
Signal Name |
Workload group queued queries |
|
Threshold |
Static |
|
Aggregation Type |
Total |
|
Operator |
Greater than or equal to |
|
Unit |
Count |
|
Threshold Value |
Varies by workload |
|
Split by dimensions: Dimension name |
Workload group |
|
Split by dimensions: Operator |
= |
|
Split by dimensions: Dimension values |
Workload Group or set of WGs you want to monitor |
|
Check Every |
15 minutes |
|
Lookback period |
1 hour |
|
Details page: severity |
Warning |
___________________________________________________________________________________
Alerts based on Log Analytics
So far all of the alerts we have created have been based on Azure Metrics data, but you also have the option of generating alerts based off of Log Analytics data. With Log Analytics you can write alerts that are very specific to your environment based on the KQL queries you can write. I don't provide recommended queries for Log Analytics alerts because you don't want to overwhelm your admins with a ton of alerts that may not be actionable. In the next section I will cover creating a health dashboard instead of generating alerts for these, but you may have a use case where you want to alert based on Log Analytics.
There are two ways to generate an alert based off of this data
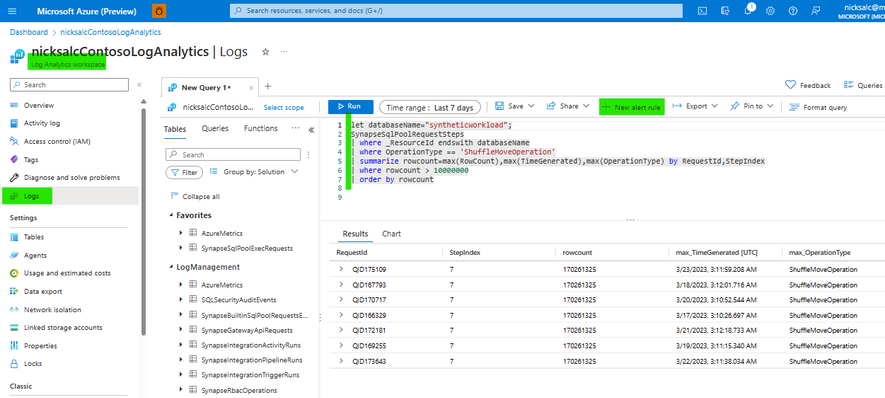
- Use the number of rows returned from the KQL query to generate an alert. In this case it's easiest to write a query that only returns rows when you want to trigger an alert. For example, you can write a query that looks for BroadcastMoveOperation where rowcount > 100,000,000. This will only return large broadcasts you want to get an alert for. I find this method to be simpler
- Use an aggregated value from one of the columns in the query. For example, you could write a KQL query that looks at data in RequestSteps and returns rows processed, then set the trigger to alert if the rows processed every exceeds 1 billion in a 5 minute period. This method tends to be more complicated so we will focus on option #1
Steps to generate alerts with Log Analytics
- Enable Diagnostic settings on your dedicated SQL Pool to send data to a Log Analytics workspace
- It is recommended to only enable ExecRequests and RequestSteps to minimize cost, however if you want to create alerts based on more detailed data you can enable more categories, just know that the high traffic on DMSWorkers and SQLRequests will increase cost for Log Analytics.
- Once this data is enabled, you can also deploy the dedicated pool monitoring workbook on top of the
- Navigate to your Log Analytics Workspace
- Write a KQL query that only returns rows when you want to generate an alert
- Once you are happy with the results of the KQL query - click '+ New alert rule' above the query window
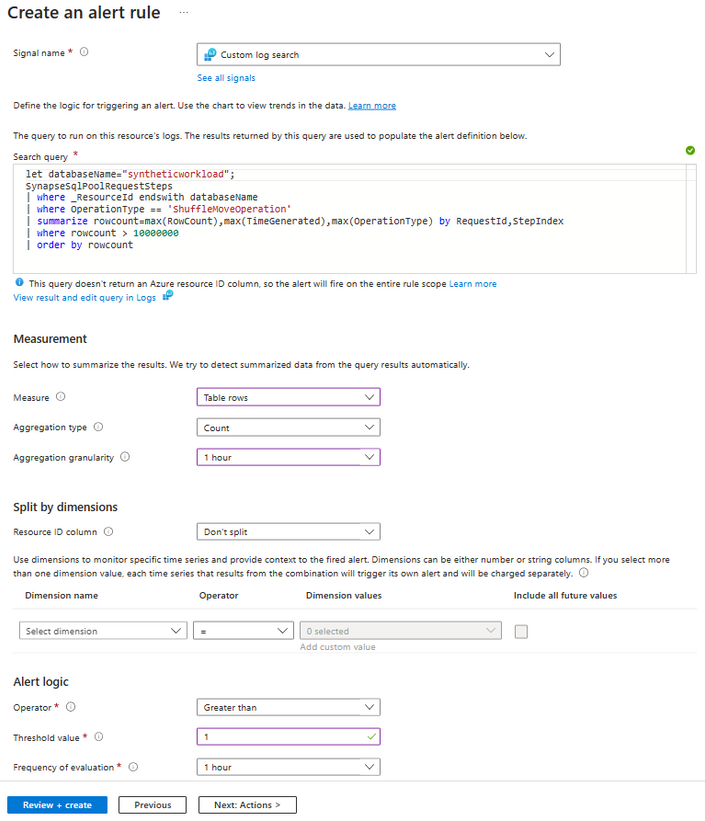
Note: this screenshot shows a query that finds ShuffleMoveOperation over 10 million rows - if you are creating a similar alert you should first focus on large BroadcastMoveOperations because a BroadcastMove is only chosen when the optimizer believes the number of rows is small.
- Set the following settings for the alert:
Measure Table rows
Aggregation Type Count Aggregation Granularity 1 hour (you may set this based on what makes sense for your alert) Split by dimensions: Resource ID column Don't split Alert Logic: Operator Greater than Alert Logic: Threshold value 1 Alert Logic: Frequency of evaluation 1 hour - Select 'Next: Actions'
- Select an existing action group or create a new action group. Follow steps 8-16 in the instructions above to finish creating an action group and create the alert.
Alternative to alerts: Dashboards
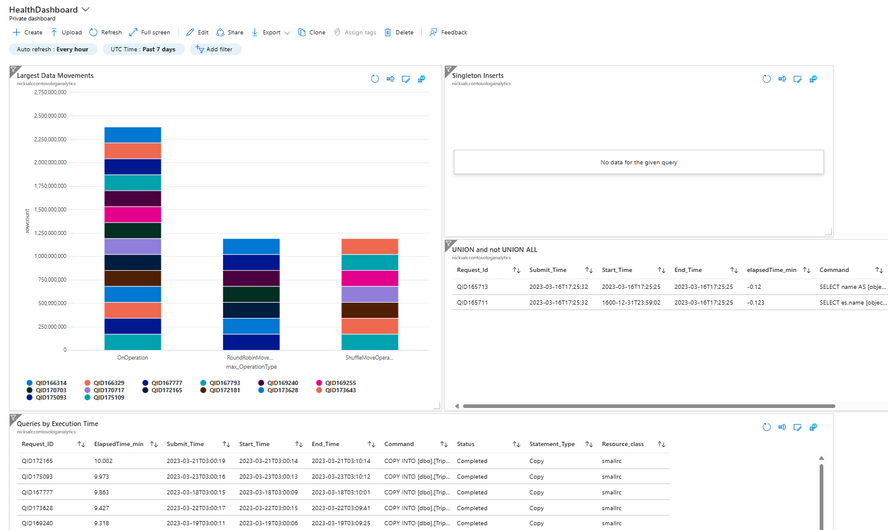
Alerts are not always the right answer when problems are detected - especially if they are not immediately actionable. I find that most of the time I would prefer to write the KQL query per the instructions above, but instead of creating an alert I will pin it to a dashboard to create a health dashboard that I can view periodically. To add your charts to a dashboard you write your KQL query in your Log Analytics workspace, then instead of clicking '+ new alert' you will click 'pin to dashboard'. After you pin many charts you can resize and rearrange them to give you a view of your system to look for common issues.
To get you started you can check the Synapse Toolbox - 'Log Analytics Queries' section for sample queries for the charts you see below. How you visualize the charts is up to you!
Summary
In this article, I walked through how to create alerts based on Azure Metrics, Log Analytics, and an alternative to creating alerts for everything - dashboards. Creating alerts is a critical part of early detection of issues and I hope this post gave you enough to get you started creating the most important alerts for your dedicated pool!
This post is part of a series of posts about monitoring Azure Synapse. Here are the other posts on monitoring by the CSE team:
- Historical monitoring dashboards for Azure Synapse dedicated SQL pools - Microsoft Community Hub
- Monitoring Synapse serverless SQL pool query history
- Azure Synapse Analyzer Report to monitor and improve Azure Synapse SQL Dedicated Pool performance
Published on:
Learn more

