Monitoring Synapse serverless SQL pool query history

This article will walk you through the different ways of how to monitor serverless SQL requests. By reviewing this article, you will understand what to see, compare and how to troubleshoot the query execution behavior. At the end of this article, I will also share how to create a solution to retain historical data from SQL requests forever.
Historic SQL Serverless query analysis is one of the crucial needs of data engineers. Serverless monitoring supports 5 main ways to analyze query history and performance. This includes Synapse Monitor Hub, DMVs, QPI library, Azure Log Analytics, and Azure Data Explorer (not covered on this article).
Let's start by reviewing Monitor hub.
Monitor hub
Monitor hub is a main feature of Synapse Studio that provides options to help you monitor the historical details about activities that happened in your workspace. e.g. pipeline runs, view the status of IRs, view Synapse Spark jobs, view SQL requests (Serverless and Dedicated), and more.
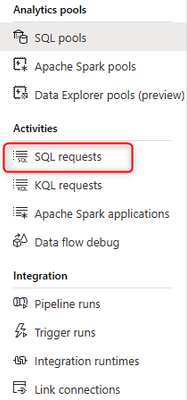
Monitor hub is divided into three groups, Analytics pools, Activities and Integration. We can quickly find the status and additional details about the built-in from these views (Analytics pool and Activities).
We will now focus on how to check initial information in Synapse serverless SQL. Using the left menu select Analytics pools > SQL pools > Built-In
After clicking on the Built-in link, we can see a bit more details as shown in the following screenshots.
The SQL request history for the built-in serverless SQL pool is shown at Activities > SQL Requests.
By default, the initial monitoring screen shows only the previous 24 hours of the submitted queries.
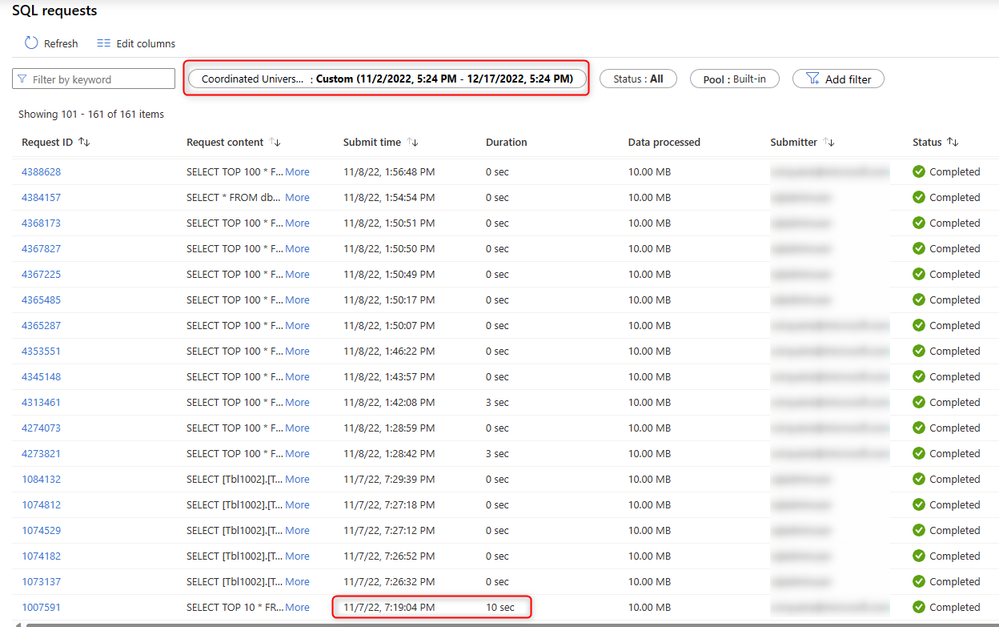
From this view we can edit, add, remove and re-order the most useful columns which will help us to have an initial visualization of the built-in SQL ended requests.
For the selected columns below, we can start our monitoring by looking at the following results: Query text of the SQL requests, submitted time, ended time, running time, data processed per each query, submitter and query status (only completed and failed).
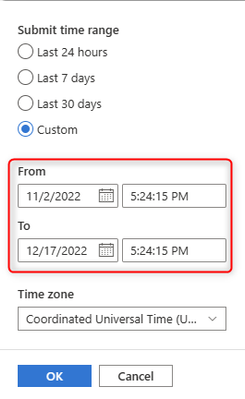
If you want to extend the monitoring time range, you can also edit the filter where shows the historical query execution per more than 24 hours, 7 days, 30 days and customized time range.
Paying attention in the screenshot below, I'm writing this article as of 12/17/2022, if we try to go back in the time range, we can only see 45 days of availability of historical executions.
After editing the filter, my latest instance of the query execution was in 11/07/2022 as we can see below.
If you want to see if a query execution is performing worse than in the last execution for two or more months ago it will not be possible. Using the monitor hub we can only see the maximum of 45 days of historic query. The next section of this article is to go through the steps on how to store the query history forever.
Let's continue…
DMVs
Dynamic Management View (DMVs) allow us to create an out-of-the-box solution to monitor and analyzing crucial metrics available by using T-SQL.
All the DMVs below will be the same as in SQL Server and some columns will be irrelevant for serverless SQL ended requests.
Public Reference:
sys.dm_exec_connections (Transact-SQL) - SQL Server
sys.dm_exec_sessions (Transact-SQL) - SQL Server
sys.dm_exec_requests (Transact-SQL) - SQL Server
My colleague
Monitoring Synapse serverless SQL open connections, where you can see how to check Serverless Open connections and how to summarize the connections per program, login and database in the built-in SQL Pool.
Some more DMVs examples for reference:
The T-SQL query is recommended to check the current running queries by joining some useful DMVs.
Looking for a historic query? Use the following T-SQL code which is the same query which runs behind the scenes in the Monitor hub.
Note: From Microsoft Support perspective we share the DMV "sys.dm_exec_requests_history" for ticket purposes to help customers better troubleshooting the SQL requests.
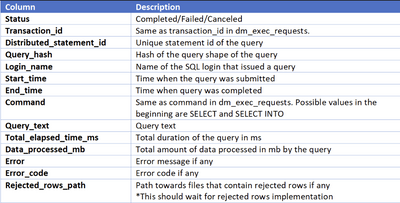
Field reference returned from "sys.dm_exec_requests_history".
Note: In the field reference example returned by querying this internal DMV, the distributed_statement_id is one of the most important column to reference for Microsoft support troubleshooting. If you are facing any issue in the serverless SQL engine, please reach the Synapse support team out by opening a service request and providing the statement id for further investigation.
You can find detailed information of how to find the statement id for support ticket purposes in the following article: How to provide statement id in the serverless SQL pool support ticket?
Running this query from SSMS, we can see the following results:
Data retention in sys.dm_exec_requests_history depends on a series of internal factors, if this information is very important to you, the best way to achieve this goal is to keep it in a Log Analytics as shown in the Log Analytics session on this article, or by creating an out of box solution to store the historical query execution forever (I will discuss this in a future article).
Additionally, the following DMV can be used to check how much data was processed during the current day, week, or month.
Public Reference:
https://learn.microsoft.com/en-us/azure/synapse-analytics/sql/data-processed
QPI Library
Query Performance Insights (QPI) for Synapse serverless SQL pool is an open-source and free set of T-SQL views that you can set up on your database and get some useful information about your queries. You can simply install this library by executing this script.
Reviewing this script code you can see that it is just referencing all DMVs mentioned above on this article with some improvements.
The interesting point here is that by using the "qpi.recommendations" view mentioned in the article from Jovan, you can also find the recommendations for optimizing your database schema.
Additionally, I am sharing below another really good article related to database optimization also written by Jovan, check out
Optimize database schema in serverless SQL pools using QPI library. In this article, Jovan is talking about the important view which returns the recommendations explaining how to optimize the schema (column types) in your serverless database.
Here are some other examples about the serverless QPI Views:
Monitoring the queries that are running on your serverless SQL pool:
Looking for query history, we can use the following QPI view:
Note: Same data from DMV sys.dm_exec_requests_history with some improvements.
Based on the best practices for serverless SQL, use this view to get the best improvement recommendations to apply to your database:
By running the following function, you can compare the characteristics of two query executions based on Distributed Statement IDs:
Log Analytics
Last but not least, you can setup a Log Analytics workspace and connect Synapse with Log Analytics to send built-in serverless SQL requests logs. You can also setup a configurable retention period for data store and start to run customized KQL queries for better monitoring of your serverless SQL queries.
Check out this article on how to setup a Log Analytics Workspace and connecting the Synapse workspace to send log to Log Analytics. This article features the rich capability of how to monitor serverless SQL ended requests metrics and logs by using workbooks. #enjoy
Public reference: Monitoring serverless SQL ended requests by using Log Analytics.
Conclusion
The idea of this article was to share with you some straightforward ways of how to monitor your Serverless SQL Pool and help you proceed with further analysis through your query history and performance considerations.
Coming soon, I will release an article on how to create an out-of-box solution to store serverless SQL Ended requests data forever.
Follow me or subscribe to this blog channel to learn more.
SIDNEY CIRQUEIRA
Synapse Analytics Support Engineer - Americas
Published on:
Learn more


