Dynamic Commentary in Power BI

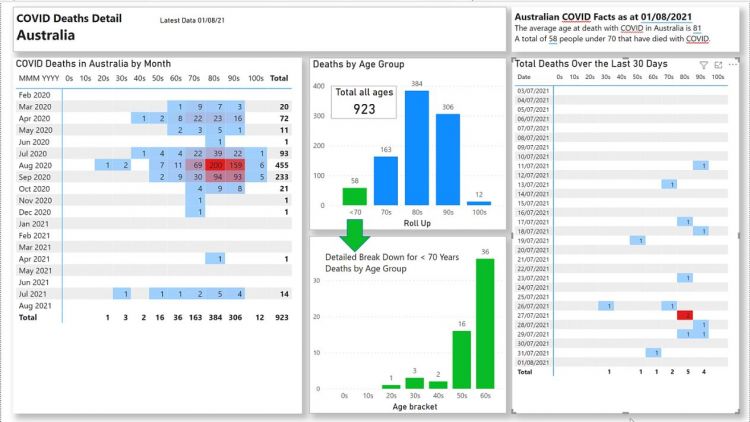
In this tutorial, the focus is on creating dynamic commentary for a COVID report for Australia. The tutorial also provides insight into the process of building a report in Power BI, including some of the challenges faced and how to navigate them effectively.
The main highlight of this tutorial is the concept of dynamic commentary, which adds depth and context to the data presented in a report. By leveraging this feature, it is possible to provide users with rich, customized insights that go beyond the raw data itself.
Whether you're building a COVID report, or working on any other type of data analysis project in Power BI, this tutorial has something for everyone. By learning how to use dynamic commentary effectively, you can become a more effective communicator and provide more value to your clients or stakeholders.
If you're interested in delving deeper, the tutorial also provides a link to a more comprehensive read on the subject, outlining how to create dynamic commentary in Power BI in more detail.
The post Dynamic Commentary in Power BI originally appeared on Excelerator BI.
Published on:
Learn moreRelated posts
Power BI Introduction Power BI Desktop | Power BI Service | Power Query | Data Modelling Data Visualization | Power BI Mobile Data Connectivity
Microsoft Power BI is a powerful and popular business intelligence and data visualization tool or suite developed by Microsoft. It enables use...
Data Visualization Technique in Power BI – Multi Measure Dynamic Visuals
In this blog post, you'll discover a powerful data visualization technique that will take your Power BI analysis to the next level — the...
Data Visualization with Power BI: Dynamic Commentary in Reports
Looking for ways to add commentary to your reports in a dynamic way? Look no further than this helpful tutorial, which showcases how to create...
Best Design Practices for Power BI Dashboards | Data Visualization Tips
In this tutorial, you'll gain insights into the best practices that can aid you in designing data-driven stories for the Power BI dashboard. T...
Power BI Sign In: How To Sign Up & Sign In
Learn how to get started with Power BI by signing up and signing in to access its vast range of features, services, and capabilities. To utili...
Power BI Dashboards for Business Central Reporting
Microsoft, a technology giant renowned for developing robust business systems, has recently launched an Enterprise Resource Planning (ERP) sol...
The Best Data Type For A Calendar Table In Power BI
Learn how to determine the best data type for a calendar table in Power BI to enhance your data visualization and reporting. A calendar table ...
Business Intelligence Components and How They Relate to Power BI
This post explores Business Intelligence (BI) components and their relationship with Power BI. Delving into the history of Business Intelligen...
Microsoft Power BI Shifts Focus to Include Data Visualization
In a surprising announcement, Microsoft has decided to include data visualization in Power BI, shifting the tool's focus from being just a dat...