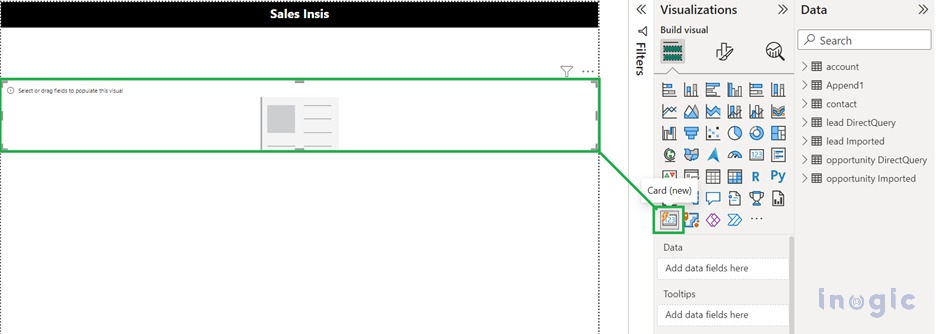
Card (new) Visual in Power BI Report within Microsoft Dynamics 365 CRM

Power BI is an interactive data visualization tool that is used to create business reports. It makes business-level decisions easy. Visuals are the visualization tools that display the data in Power BI. There are many types of visuals based on different needs and requirements. A Card is a way to enhance the data in a… Read More »
The post Card (new) Visual in Power BI Report within Microsoft Dynamics 365 CRM first appeared on Microsoft Dynamics 365 CRM Tips and Tricks.
Published on:
Learn more