New Slicer Visual in Power BI Report within Microsoft Dynamics 365 CRM

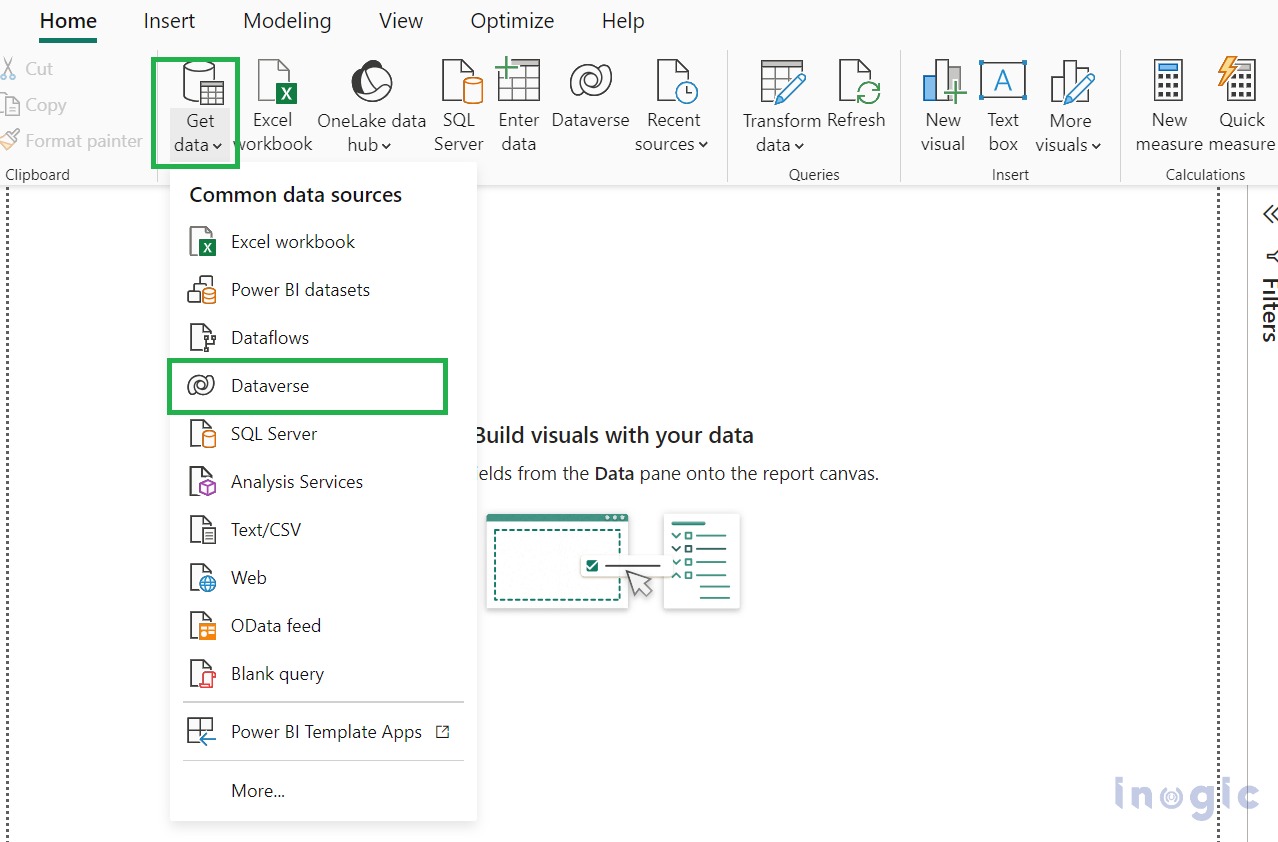
Power BI is an analytical tool to design interactive Reports, and dashboards using Visuals, which allows information to be collected from different types of Sources such as Dataverse, SQL, Excel Workbooks, OData Feed, etc. There are various visuals available to design our Power BI report, such as Card, Slicer, and Matrix in Power BI. Microsoft… Read More »
The post New Slicer Visual in Power BI Report within Microsoft Dynamics 365 CRM first appeared on Microsoft Dynamics 365 CRM Tips and Tricks.
Published on:
Learn moreRelated posts
How To Get The Details Of Power BI Operations Seen In The Capacity Metrics App
It’s the week of Fabcon Europe and you’re about to be overwhelmed with new Fabric feature announcements. However there is a new bl...
Security Model of Dynamics CRM
Business Unit – It is a way to group business activities.When an organization is created, a Root Business Unit is created by default. Thi...
Deprecation of Power BI Integration within SharePoint Lists and Libraries
Today, we are announcing the retirement of the Power BI integration within SharePoint lists and libraries. This change impacts customers who c...
AI and Agentic Development for Power BI
New Fabric Tenant Setting: “Set alert” Button Visibility for Power BI Users
A new Microsoft Fabric tenant setting will make the “Set alert” button visible to all Power BI web users, enabling them to create Fabric Activ...
What Happens When Power BI Direct Lake Semantic Models Hit Guardrails?
Direct Lake mode in Power BI allows you to build semantic models on very large volumes of data, but because it is still an in-memory database ...