Network traffic observability with virtual network flow logs
Azure Network Watcher provides network monitoring and troubleshooting capabilities to increase observability and actionable insights with out-of-box health metrics & topology visualization, connectivity monitoring, traffic monitoring and diagnostics suite. For on-premises workloads, network administrators rely on NetFlow or IPFIX to address these use cases. Virtual network flow logs are a capability of Network Watcher service to address these scenarios for Azure and hybrid networks and we are excited to announce that virtual network flow logs are now transitioning from public preview to general availability.
Overview
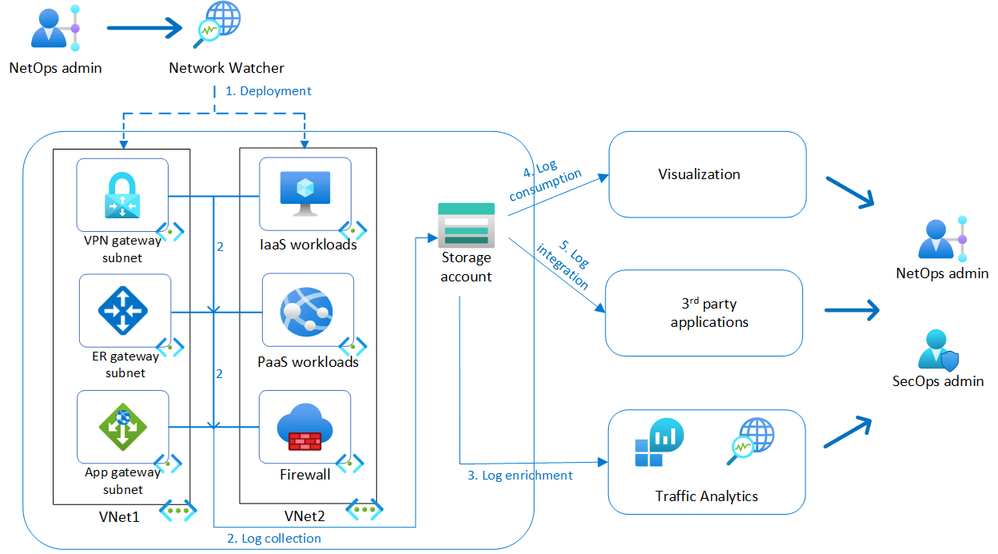
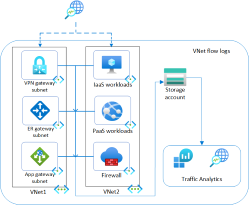
Virtual network flow logs record layer-4 IP traffic flowing through a virtual network capturing the 5-tuple (source IP, destination IP, source port, destination port, protocol) and traffic volume information with no impact to application performance.
- Deployment: virtual network flow logs can be enabled by NetOps admin for desired scope of virtual networks, subnets, or network interfaces.
- Log collection: Inbound and outbound traffic is recorded at each network interface of the supported workloads and ingested to a storage account in JSON format for analysis and cost-effective retention.
- Log enrichment: Traffic Analytics can be enabled as an add-on functionality to process the raw flow logs, aggregate them at longer intervals, and enrich them with environmental metadata for advanced insights into user and application activity and malicious communication patterns.
- Log consumption: Virtual network flow logs can be accessed directly from storage accounts or integrated with out-of-box visualization such as Power BI.
- Log integration: Virtual network flow logs can be integrated with 3rd party applications for network and security analysis.
Use cases of virtual network flow logs
Network security group flow logs and virtual network flow logs address the following use cases:
Network troubleshooting
- Troubleshoot network connectivity between source and destination endpoints.
- Identify overly restrictive or permissive access control rules.
- Identify network security group (NSG) or Azure Virtual Network Manager rules blocking traffic.
Usage monitoring and optimization
- Identify top talking hosts and top communicating applications across or within networks.
- Monitor and visualize traffic levels and bandwidth consumption for cross-region traffic.
- Identify unknown or undesired traffic.
Compliance
- Record all network activity with configurable retention intervals to meet audit requirements.
- Use flow data to verify network isolation and compliance with enterprise access rules.
Network forensics and security analysis
- Analyze network flows from compromised IPs and network interfaces.
- Identify ports and hosts communicating with public IPs or internet.
- Integrate with 3rd party Intrusion Detection System (IDS) or Security Information and Event Management (SIEM) tool of choice for advanced detections and threat hunting.
Comparison to NSG flow logs
NSG flow logs also enable traffic recording but had limitations that virtual network flow logs overcome.
|
Capability |
NSG flow logs |
Virtual network flow logs |
|
Scope of enablement |
NSG |
Virtual network, subnet, network interface |
|
Identification of allowed/denied traffic in NSG rules |
Yes |
Yes |
|
Identification of allowed/denied traffic by Virtual Network Manager security admin rules |
No |
Yes |
|
Support of Virtual Network encryption |
No |
Yes |
|
Traffic volume (bytes and packets) for stateless flows |
No |
Yes |
|
Extensive resource coverage |
No |
Yes |
|
Price |
Billed per gigabyte of Network flow logs collected |
Billed per gigabyte of Network flow logs collected |
NSG flow logs can be migrated to virtual network flow logs for simplified transition to new capabilities.
Using virtual network flow logs
Virtual network flow logs can be enabled on one or more virtual networks using Azure Portal, PowerShell, AzCLI or Policy, with no requirement to attach NSGs to those virtual networks. The example below is a snippet of the flow log retrieved from storage account. Traffic flows are recorded as comma separated values with IP, port and volume information recorded under 'flowTuples'. Traffic flows are unencrypted, as Azure virtual network encryption has not been enabled, indicated by ‘NX’.
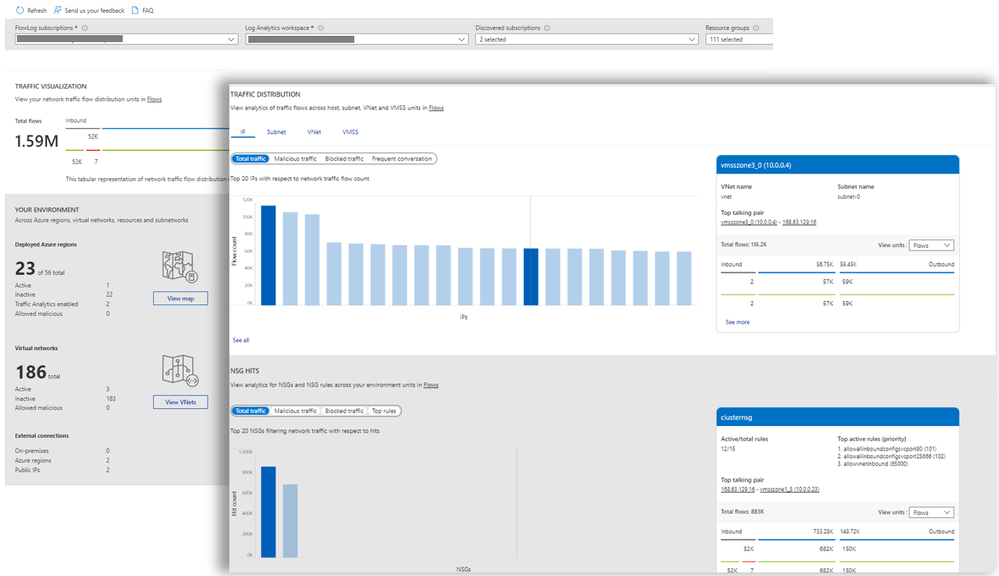
With Traffic Analytics enabled, advanced insights on environment, traffic distribution, usage patterns, malicious flows across regions can be visualized with additional capabilities to slice and dice the data as per requirement in a Log analytics workspace with Kusto queries.
Scenarios addressed with virtual network flow logs
Demo environment
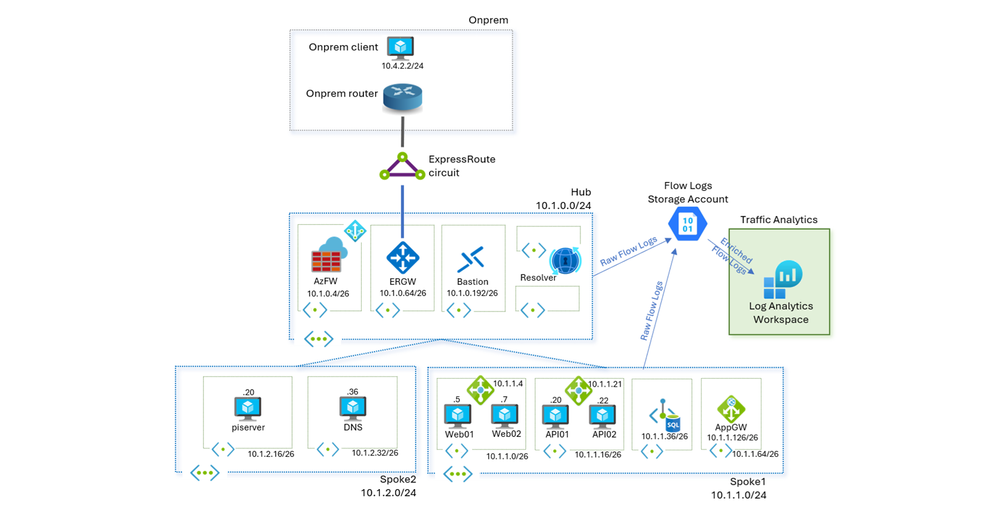
To demonstrate some of the scenarios described above, Azure environment comprising a hub and spoke topology is used, with the hub containing a Firewall, Bastion, DNS Private Resolver, and connectivity to on-premises via ExpressRoute gateway. Spoke1 has a sample application deployed on virtual machines with load balancers fronting each tier, and a private endpoint connected to an SQL Database for the DB tier. Spoke2 has sample workloads to test spoke-to-spoke traffic. Network Watcher virtual network flow logs and Traffic Analytics have been enabled on Hub and Spoke virtual networks.
Scenario 1: Troubleshooting virtual network manager security admin rules
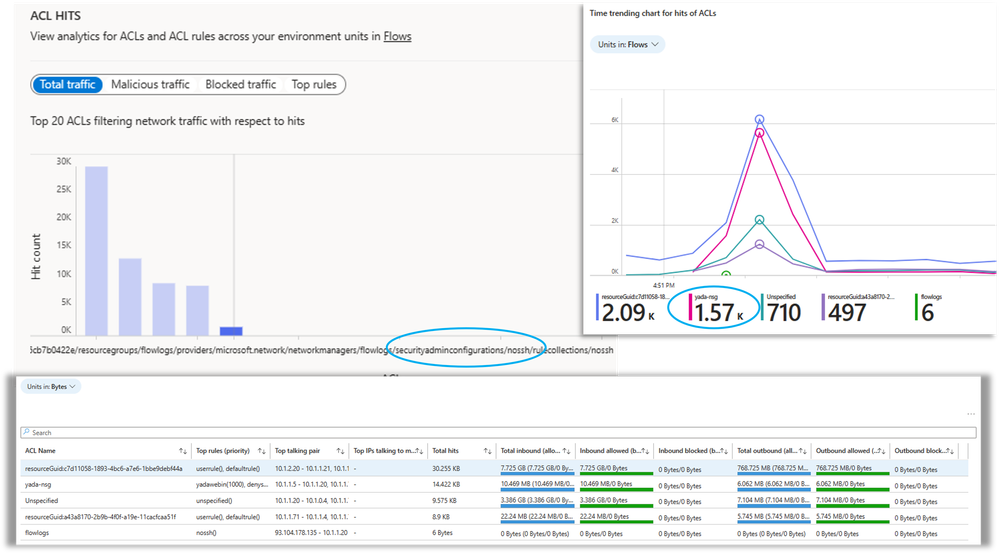
Organizations typically have the requirement to log when network traffic is allowed or denied, to satisfy regulatory requirements and assist with troubleshooting in day-to-day operations. Network administrators can allow or deny traffic in a virtual network either using NSGs or Azure Virtual Network Manager security admin rules. Both mechanisms are logged using virtual network flow logs enabling visibility into traffic being allowed or denied.
In this case, there are both NSGs and Azure Virtual Network Manager security admin rules applied to the environment. An NSG named 'yada-nsg' has the second highest flow volume and an Azure Virtual Network Manager security admin rule called “nossh” is dropping SSH traffic to all virtual machines in the virtual network. Traffic Analytics dashboards shows the Access Control Lists (ACLs) hitting most traffic. Additional insights can be derived by navigating to Log Analytics workspace and modifying pre-built Kusto queries. To address scenarios such as troubleshooting failed SSH connections, an audit trail of SSH connection attempts from both internal and external IP addresses can be listed.
Scenario 2: Simplifying traffic visibility by enabling virtual network flow logs on hub virtual network
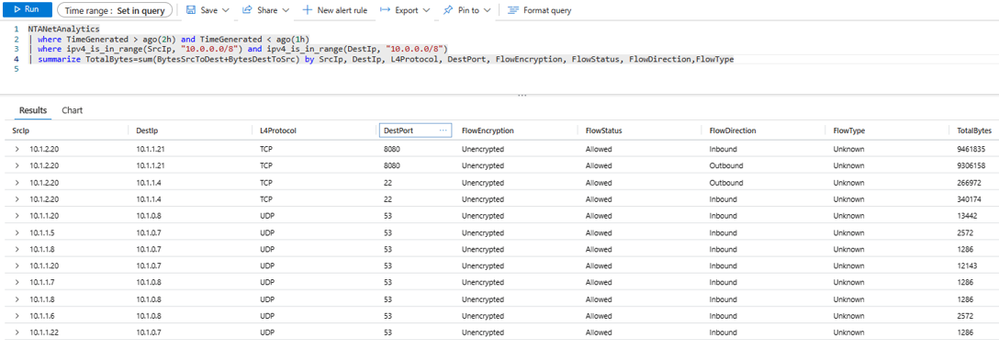
Virtual network flow logs allow optimization of log volume and simplification of management by enabling them at hub virtual network. All traffic flowing through the hub, including spoke-to-spoke traffic is recorded on the hub virtual network. In the topology of demo environment, traffic between the spokes is routed via hub firewall. The example query below aggregates throughput between internal IP addresses for specified ranges. An endpoint on Spoke2 (10.1.2.20) can be seen accessing another API endpoint on Spoke1(10.1.1.21) on port 8080, connecting to Web endpoint on Spoke1(10.1.1.4) via SSH and establishing DNS connectivity with Hub(10.1.0.8) on port 53. Traffic patterns between spoke virtual networks can be aggregated over time to distinguish hub-to-spoke vs spoke-to-spoke volume.
Scenario 3: Hybrid traffic visibility with ExpressRoute gateway
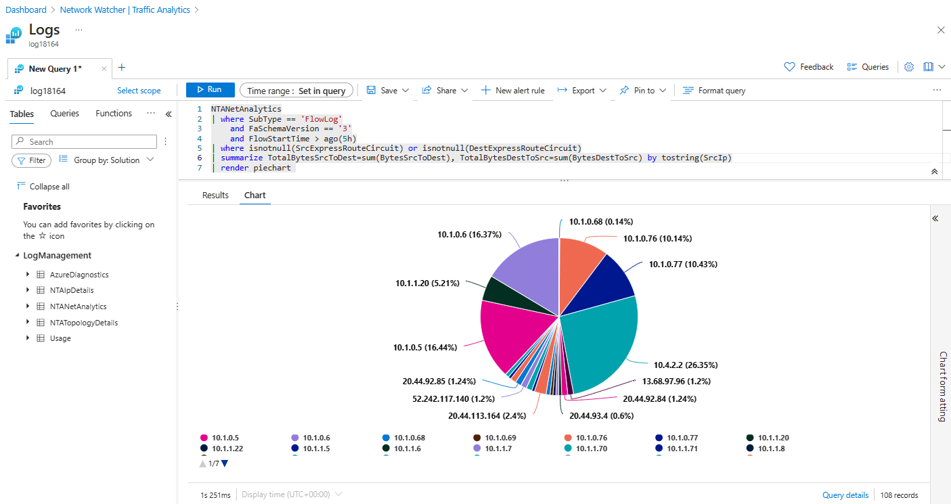
Typical enterprise deployments include a combination of Azure and on-premises workloads with significant traffic traversing ExpressRoute or VPN gateways. Estimating the overall traffic volume on ExpressRoute circuits and identifying the workloads that are consuming significant bandwidth on these circuits enables capacity planning, cross-charging internal teams, or re-architecting application communication to optimize costs. Further investigation to identify the top consumer of bandwidth (26%) in this ExpressRoute circuit (10.4.2.2) can be achieved to list top communicating endpoints, as well as timeline view of bandwidth patterns to eliminate anomalous patterns.
Conclusion
Virtual network flow logs enable centralized visibility of traffic patterns across virtual machines and scale sets, application gateways, load balancers, ExpressRoute gateways, VPN gateways and firewalls. Network and security administrators can leverage these flow logs to ensure organizational needs around network observability and compliance are met in a light-weight scalable manner. In addition, virtual network flow logs enable detection of security vulnerabilities and aid in threat hunting investigations with a complete trail of user and application activity.
Virtual network flow logs currently support the following 3rd party applications with seamless integration for additional scenarios:
Virtual network flow logs will eventually be billed per gigabyte of logs generated. For more information, see Network Watcher pricing (Network flow logs collected).
Learn more
Published on:
Learn moreRelated posts
Power Automate: sort Function
Power Automate's sort function arranges arrays in ascending order by value or property. Learn usage tips, the string-vs-number gotcha, and how...
AI-Powered Approval System Using Copilot in Power Apps and Power Automate Flow
Modern approval processes are often slow, manual, and inconsistent, leading to delays, policy violations, and poor decision-making. In this so...
Power Automate: Office 365 Outlook - When a new event is created Trigger
The "When a new event is created" trigger monitors your Outlook calendar in Power Automate. Learn about UTC gotchas, duplicate triggers, and t...
[REDACTED] message when turning on a Power Automate flow
We all like useful error messages. How about the [REDACTED] Message when you turn on a flow? In this post you will find the steps to fix this ...
Power Automate: Do Until Action
The "Do Until" action loops in Power Automate until a condition is met. Learn its limits, why it always runs once, and how to avoid runaway lo...
Use Inventory to find your Power Automate flow?
How often do you want to find a flow, but you can’t remember which environment you created the flow in? It can be quite a
Power Automate: reverse Function
Learn how to use the Power Automate reverse function to flip the order of items in an array. Includes examples with strings, objects, and sort...
