Auto scaling Azure Redis Clustered Cache using cache metrics alerts
Problem statement:
Azure Cache for Redis has many uses, including data caching and session management. Many a times we see a sudden burst of traffic on our application, pushes our Azure Redis Cache under stress due to increased operations, active connections, memory usage etc. This causes cache's Server Load to spike, which adversely impacts application performance.
Server Load is the percentage of cycles in which the Redis server is busy processing and not waiting idle for messages. If this counter reaches 100, it means the Redis server has hit a performance ceiling and the CPU can't process work any faster. If you're seeing high Redis Server Load, then you see timeout exceptions in the client. In this case, you should consider scaling up or partitioning your data into multiple caches.
Why monitor Server Load and not CPU utilization? The CPU utilization of the Azure Cache for Redis server as a percentage during the specified reporting interval. This value maps to the operating system \Processor(_Total)\% Processor Time performance counter. This metric can be noisy due to low priority background security processes running on the node, so Azure Cache for Redis recommends monitoring Server Load metric to track load on a Redis server.
Refer the metrics and their definitions here. https://docs.microsoft.com/en-us/azure/azure-cache-for-redis/cache-how-to-monitor#aggregation-types
Solution
As described in this documentation, we can programmatically scale up/down an Azure Redis Cache instance. So we are going to use this code to scale our clustered cache when needed.
We are going to identify this need by monitoring cache's Server Load and triggering alerts based on acceptable thresholds.
1. Function App:
We will create a FunctionApp and in that we need two functions to scale up and scale down an Azure Redis Cache when executed. We will not be covering creating FunctionApp and Triggers in this blog. If you want to learn more about creating functions, you can follow this documentation.
1.1 Getting an auth token
Using 'Microsoft.IdentityModel.Clients.ActiveDirectory' we need to get an auth token that we will use when performing management operation on our cache. We are using a service principal(SPN) in this example, and this SPN has 'Contributor' role on this cache.
Please refer these documentations, if you want to know more about creating an SPN and assigning role assignments.
https://docs.microsoft.com/en-us/cli/azure/create-an-azure-service-principal-azure-cli
1.2 Extracting cache resource details:
These functions will be executed by an alert. We will be relying on the common alert schema (which we will enable later) to dynamically identify, which cache resource we will be scaling. The below code reads the request body and extracts the Resource ID for which this alert has been triggered.
1.3 Scaling Up
In our function for scaling/managing our cluster, we will be using the following code. I have used the Microsoft Azure Management Library package 'Microsoft.Azure.Management.Redis' in this example. These packages are now 'previous version'. There is a new set of management libraries that follow the Azure SDK Design Guidelines for .NET and based on Azure.Core libraries. But at the time of writing this blog, new management library for Azure Redis was still in development.
1.4 Scaling Down
Using the same logic as above, in the below example we are reducing the shard count, when scaling down the cache.
Deploy the Function App to your Azure Subscription. Please refer the documentation link shared above for the same.
2. Creating Alert rules
We will now setup alert rules on our cache and create an action group to execute the functions when the conditions defined in the rule are met.
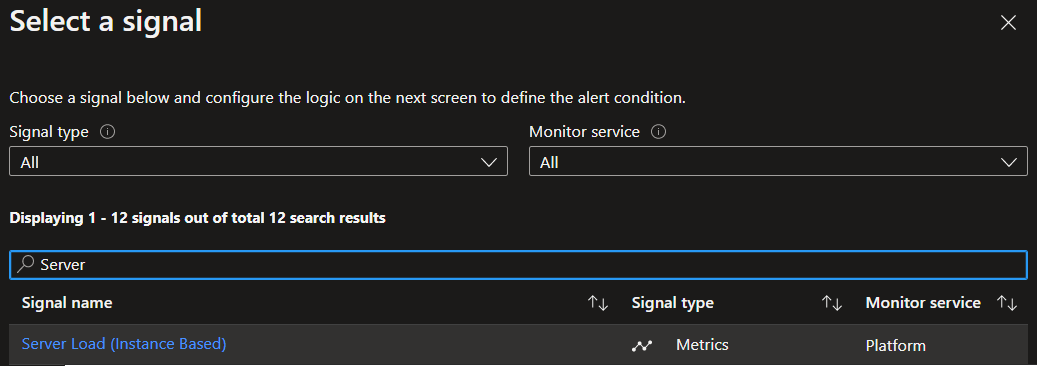
We will create an alert rule on 'Server Load (instance based)' and specify the frequency & threshold.
2.1 High Server Load
For testing and for the sake of this blog, I have used a very short frequency and threshold to trigger this alert. More about threshold and frequency at the end of this blog.
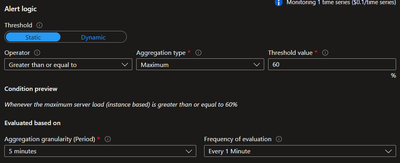
I have setup this rule to trigger alert when the maximum server load is greater than or equal to 80. This will be evaluated every minute and on each evaluation, last 5 minutes of data will be analysed.
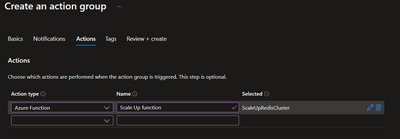
In the action group for this alert rule, we need to configure execution of our scale up function.
Make sure to enable 'common alert schema', as we need this information to identify for which resource this alert was triggered.
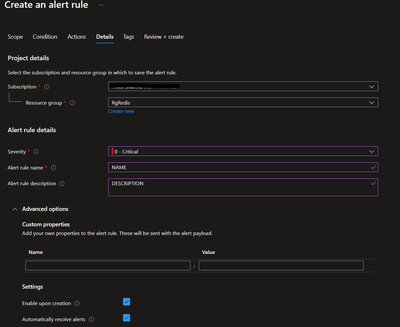
In the alert rule details, please fill the details as per your requirement. We need to select 'automatically resolve alerts'. This will resolve the alert once the server load falls below the configured threshold. The reason why we need to do this is, when the alert is triggered/fired, on each subsequent evaluation if it finds the current level exceeding the threshold, it will not re-trigger/fire another alert. It will wait for the current alert to resolve.
2.2 Low Server Load
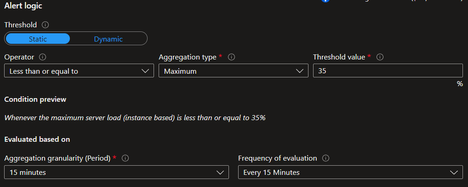
Using the same steps as above, create another alert rule for monitoring low server load. Only difference being the threshold and frequency of evaluation for this rule.
As low server load isn't affecting application performance, you can keep the severity of this alert rule as 'Informational'.
3. Testing
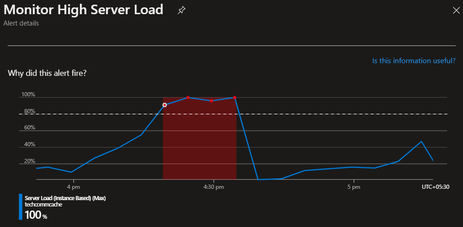
As mentioned earlier, for the sake of this blog I have configured the alerts to suit my tests. Once we see the server load crossing 80%, after few minutes the alert is triggered.
I created load on my cache by running multiple instance of redis-benchmark from 2 Azure VMs.
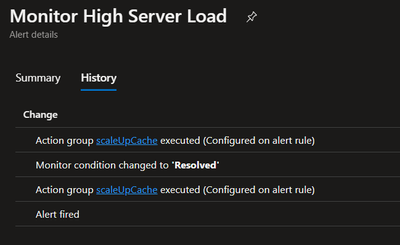
We can see that the Function scaleUpCache was executed.
When the Server Load goes down, below threshold level, the alert is auto-resolved as we configured it. This also triggers a call to the Function. Thus we have the condition in our Function to only handle 'Fired' alerts not 'Resolved' alerts.
Once the 'High Server Load' event was triggered, we can see that Redis resource is scaling and shard count increasing.
If you are running redis-benchmark to test, you can stop the running instances and we could see the Server Load coming down.
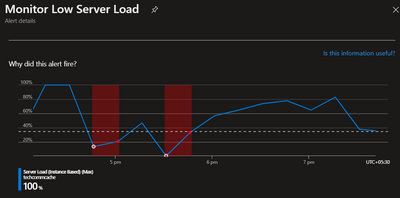
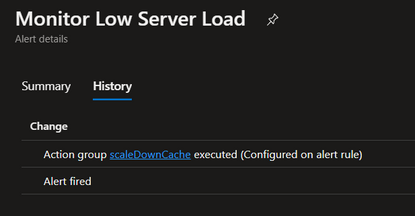
Based on the frequency and granularity of evaluation, once Server Load falls below the threshold for Low Server Alert, after few minutes we can see this alert triggered.
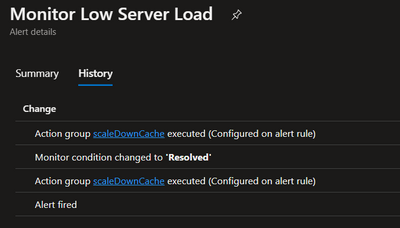
We can see that configured Function was also executed.
We can see shard count is reduced:
If your Server Load goes up again above the threshold for Low Server Load alert, based on the frequency and granularity of evaluation, the alert will get auto-resolved. Else, this alert will remain in 'Fired' condition.
4. Points to note
- Metrics for cache or any other resource could take few minutes to update. Also, based on the evaluation frequency it could take few more minutes for your alert to trigger and call your Function.
- Scaling clustered caches can take anywhere from a few minutes to several hours depending on the amount of data that needs to be migrated.
- Threshold values used for alerts in this blog are not a recommendation. These values will differ from client to client and application to application. You will have to understand the usage pattern of your application and cache. Based on that define alerts, threshold, frequency and granularity of your alerts.
Published on:
Learn moreRelated posts
Azure Data Studio is retired: Move your Azure SQL workflow to VS Code in 10 minutes
Azure Data Studio retired on February 28, 2026. The recommended path forward is Visual Studio Code with the MSSQL extension. If you used ADS d...
Axios npm Supply Chain Compromise – Guidance for Azure Pipelines Customers
On March 31, 2026, malicious versions of the widely used JavaScript HTTP client library Axios were briefly published to the npm registry as pa...
Azure MCP Server now available as an MCP Bundle (.mcpb)
Azure MCP Server is now available as an MCP Bundle (.mcpb), enabling one-click installation into Claude Desktop and other MCP-compatible clien...

