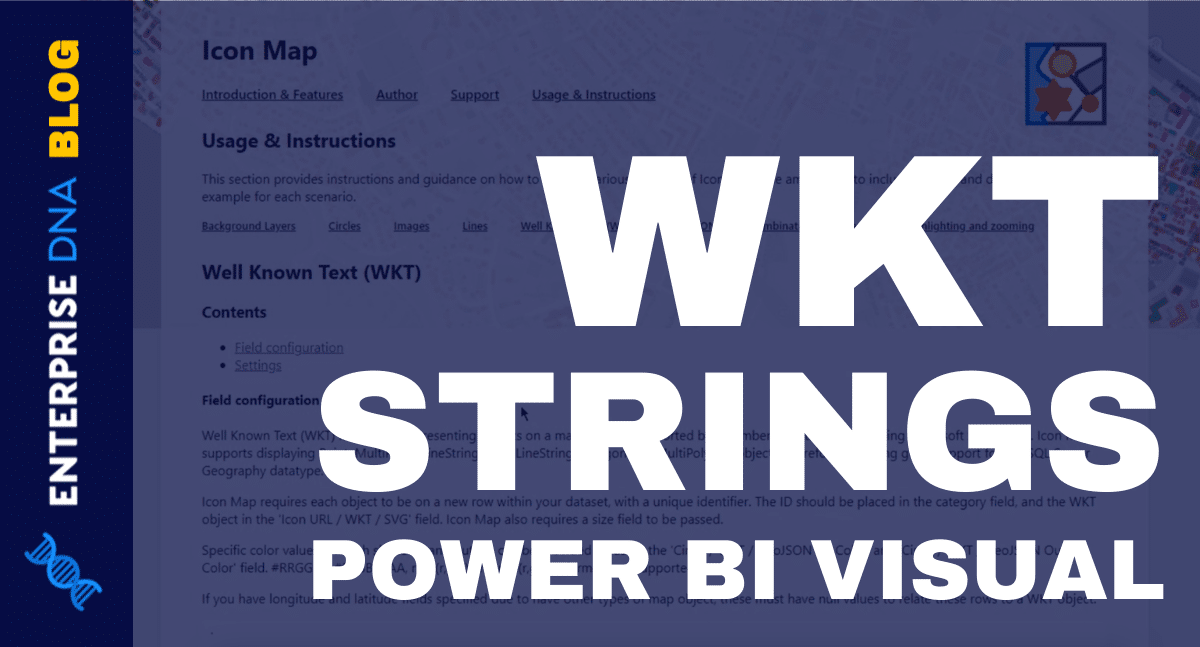
Power BI Icon Map Visual: WKT Strings

If you're interested in incorporating geospatial data into your Power BI projects, this tutorial is a must-read. Here, you'll learn how to use the Well Known Text feature in the Power BI Icon Map visual. This powerful visual tool is highly versatile, making it a top choice for complex mapping projects.
This tutorial will equip you with the knowledge you need to make the most of the Power BI Icon Map's functionality. You'll get an in-depth explanation of how to utilize the Well Known Text feature for an even more seamless and efficient mapping experience. Whether you're a seasoned Power BI user or a newcomer to the world of geospatial analytics, this tutorial offers valuable insights that can take your projects to the next level.
To see the full details of how to use the Well Known Text feature in the Power BI Icon Map visual, click on the link provided and check out the full article on the Enterprise DNA blog.
The post Power BI Icon Map Visual: WKT Strings was originally published on Master Data Skills + AI.
Published on:
Learn moreRelated posts
Data Visualization Technique in Power BI – Multi Measure Dynamic Visuals
In this blog post, you'll discover a powerful data visualization technique that will take your Power BI analysis to the next level — the...
Using Dynamic Visuals On Ranking Based Parameters In Power BI
In this tutorial, you'll learn how to adjust the size of your visual dynamically based on the result rankings in Power BI. The video tutorial ...
Power BI Custom Icons | PBI Visualization Technique
Custom icons can be a powerful tool in creating dynamic Power BI visuals. In this tutorial, the author shares one of their favorite techniques...
Power BI Visuals Tutorial | How To Easily Move Visuals
This blog post provides readers with a step-by-step Power BI visuals tutorial on how to easily reposition visuals using the ellipsis. The tuto...
Power BI Copilot: Enhancing Data Analysis with AI Integration
If you're looking for an intelligent assistant to help you navigate your data analysis, then Power BI Copilot is the tool you need. This innov...
What Is Power BI Used For?
Power BI is a powerful tool for analyzing and visualizing data that is essential in today's dynamic and data-driven business landscape. It is ...
Power BI Tips And Tricks For Your Reports
Are you struggling with creating impactful reports through Power BI? Avoid the pitfalls of ineffective reporting with the help of these valuab...
Matrix Visualization In Power BI
If you're looking to elevate the visual appeal of your reports, this tutorial on Matrix Visualization in Power BI is a must-read. The post sho...
Business Intelligence Components and How They Relate to Power BI
This post explores Business Intelligence (BI) components and their relationship with Power BI. Delving into the history of Business Intelligen...