Using Dynamic Visuals On Ranking Based Parameters In Power BI

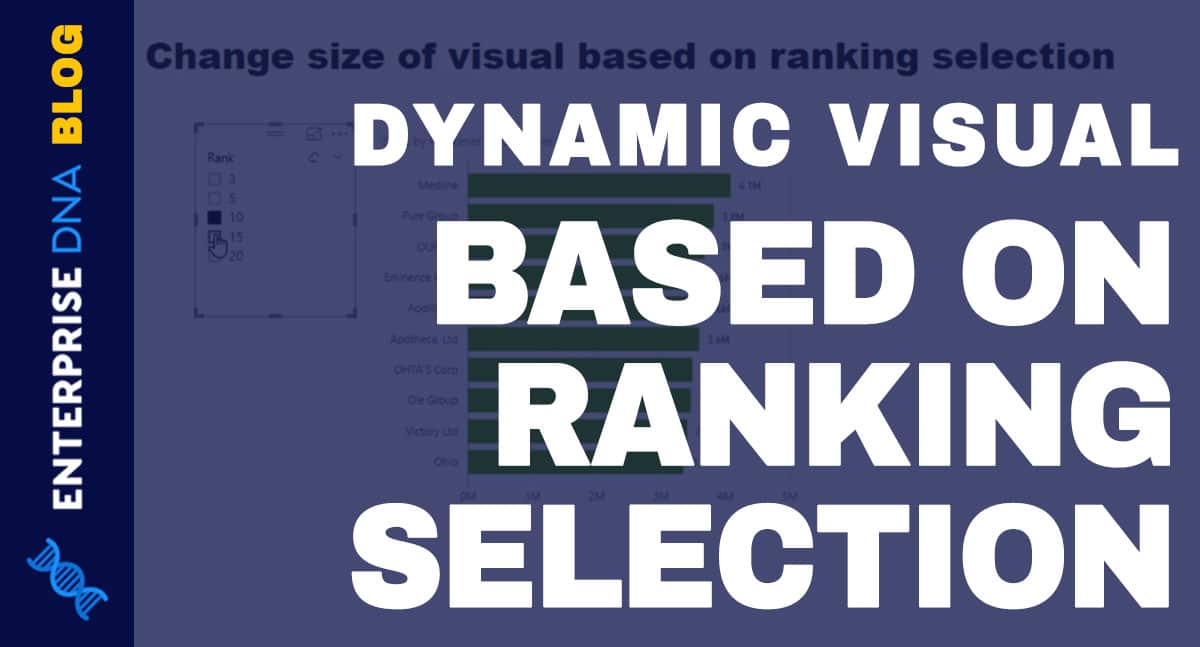
In this tutorial, you'll learn how to adjust the size of your visual dynamically based on the result rankings in Power BI. The video tutorial at the bottom of the blog delves into the details of the example used to illustrate this concept. By creating dynamic visuals, you can convey insights in a clear and comprehensive manner, making your dashboard more impactful.
By leveraging the power of ranking based parameters, you'll be able to create visuals that adjust dynamically, highlighting important insights and trends as they emerge. Whether you're an experienced data analyst or a newcomer to the Power BI ecosystem, this tutorial provides valuable insights into the art of effective data visualization.
Check out the full post on the Enterprise DNA blog to learn more about this powerful technique and gain insights into how to make your visuals more dynamic and engaging.
The post Using Dynamic Visuals On Ranking Based Parameters In Power BI was originally published on Master Data Skills + AI.
Published on:
Learn moreRelated posts
Data Visualization Technique in Power BI – Multi Measure Dynamic Visuals
In this blog post, you'll discover a powerful data visualization technique that will take your Power BI analysis to the next level — the...
Dynamic Tooltip In Power BI With Embedded Charts
Discover an exciting new feature in the Power BI suite - the dynamic tooltip. With dynamic tooltips, you can enhance your visualizations and a...
How To Create Dynamic Power BI Reports
If you're looking to create dynamic Power BI reports, this tutorial is the perfect place to start. Using the "measuring branching" technique, ...
Top 21 Power BI Reports: Inspiration to Visualize Your Data
For those seeking a robust data visualization and analysis tool, Power BI reports can be a valuable asset. With Power BI, you can generate mul...
How to Add Power BI to Excel: A Step-By-Step Guide
If you want to enhance your data analysis skills, adding Power BI to Excel can take them to the next level. Power BI is an analytics platform ...
What Is Power BI Used For?
Power BI is a powerful tool for analyzing and visualizing data that is essential in today's dynamic and data-driven business landscape. It is ...
18 Incredible Power BI Dashboard Examples
If you're looking for inspiration for your Power BI dashboards, this post has got you covered. Here you'll find a curated list of 18 incredibl...
How To Get Your Dataset’s Top N In Power BI
If you're looking to get the top N items in Power BI based on a specific metric, this informative blog is the perfect place to start. Using Qu...
Let your data talk for you - Interactive Power BI in Power Point
In the realm of data visualization, Power BI dashboards have become an invaluable tool for crafting compelling stories with data. Now, a new f...