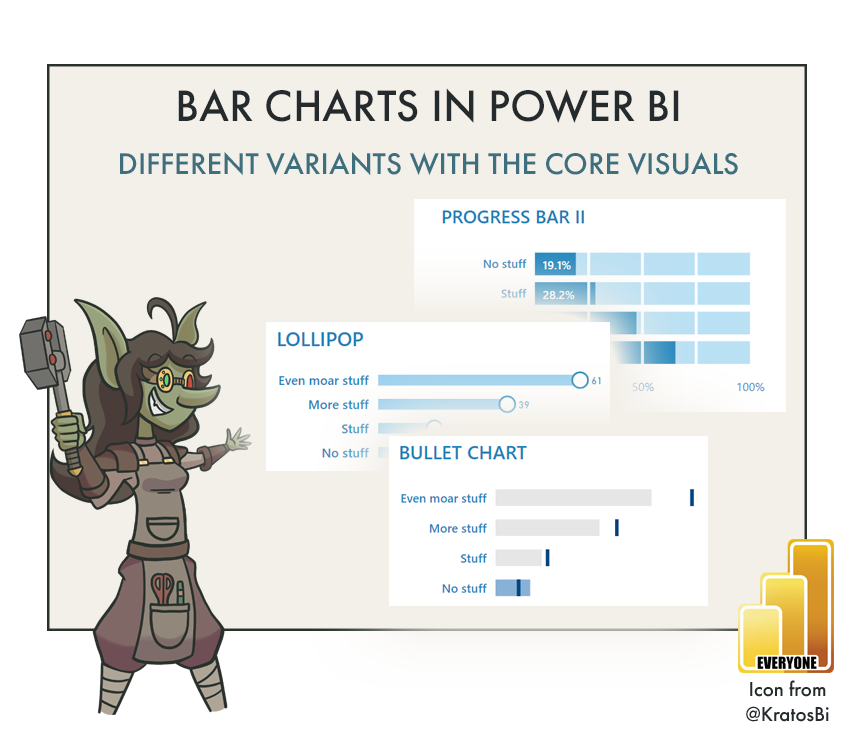
Bar Charts in Power BI

Published on:
Learn moreRelated posts
Measuring Time To Display For Image Visuals In Power BI With Performance Analyzer
Carrying on my series on troubleshooting Power BI performance problems with Performance Analyzer, another situation where a report may be slow...
Retirement of Power BI Q&A
Power BI Q&A, the legacy natural language tool, will retire by December 2026. New Q&A visuals cannot be created, and existing ones w...
Power BI: End of support for on-prem SharePoint web part
Support for the SSRS Report Viewer SharePoint Webpart ends April 13, 2026. It will remain functional but unsupported. Organizations should tra...
Measuring Geocoding Performance In Power BI Map Visuals Using Performance Analyzer
When a user complains about their Power BI report being slow it’s normal for the developer to open up DAX Studio and start tuning the me...
The Power BI Dataviz World Champs is back!
Join the Power BI Dataviz World Championships – three rounds of visualization challenges, community voting, and a live finale at FabCon ...
Power BI Report metadata defaults to Power BI Enhanced Report format (PBIR)
Starting January 25, 2026, Power BI reports will default to the Enhanced Report format (PBIR), improving source control and collaboration. Exi...
Power BI Progress Bar You Haven't seen Before
Diagnosing Power BI DirectQuery Performance Problems Caused By SQL Queries That Return Large Resultsets
One very common cause of Power BI performance problems is having a table with a large number of rows on your report. It’s a problem I wr...