Monitoring Life Cycle Management Policy Runs
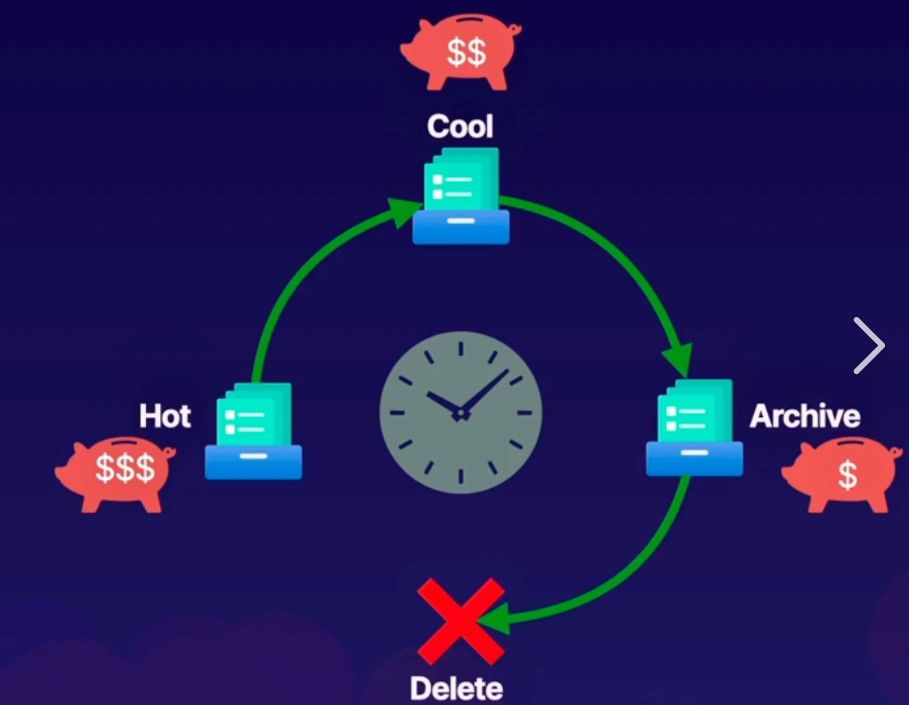
The blog talks about how you can leverage the existing metrics and diagnostic logging to monitor or track the execution of lifecycle management policies.
To start, with the Lifecycle management, you will be mainly transitioning blobs from one tier to another or delete the blobs based on the specified rule configuration. So, either Set Blob Tier (REST API) - Azure Storage | Microsoft Learn or Delete Blob (REST API) - Azure Storage | Microsoft Learn will be called underneath respectively.
Now, the policy executes as part of backend scheduling and so the exact timings as to when the policy be executing on a particular day isn’t available directly. However, the policy will run once a day, and we can check for these metrics specifically. We will do this via a 2-step method.
Step 1
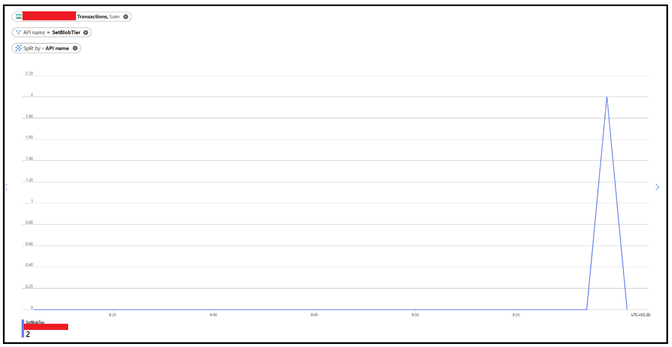
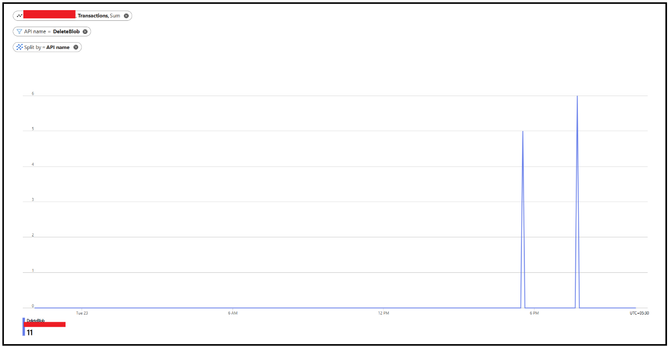
You can start by navigating to Monitoring Tab and thereafter select Metrics option. Select the Account as Metrics Namespace and Transactions as Metric. Considering the policy runs once in 24 hours we can keep the time range of last 24 or 48 hours.
Post that you can apply splitting based on API name and filter specifically for the 2 API’s i.e. SetBlobTier or DeleteBlob
You can only apply splitting too which will highlight the API however with other operations happening, filtering specifically with the API name give a cleaner picture.
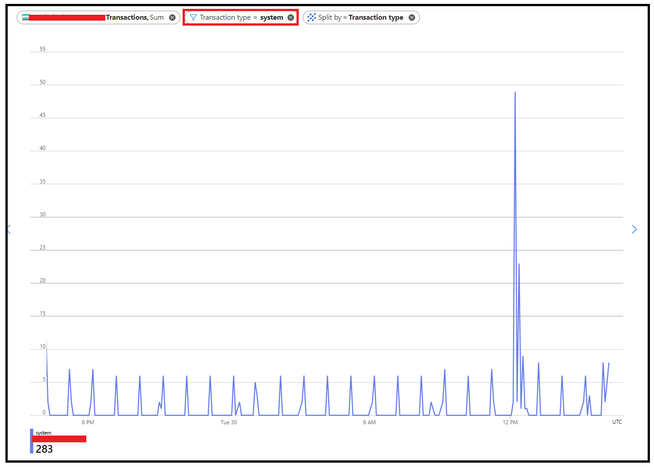
Another option is to apply a filter of Transaction Type as System as LCM request come as System requests. Now, there could be other system requests however you can apply filtering via logging as discussed in the step 2 to narrown down the results.
With this step, it will give you an indication on when these operations were performed in terms on timings.
Step 2
This step is inclined to use the diagnostics logging to verify if these operations were performed using lifecycle management policy or not. Once we have identified the timings from step 1, we can use that to narrow down the query window in Step 2 or you can completely skip step 1 and directly run a flat query checking for operation specifically as well.
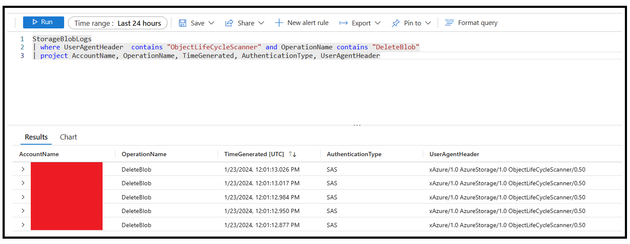
Typically, for the Life Cycle Management, the user Agent Header shall be something like "ObjectLifeCycleScanner" or "OLCMScanner" so we will put our query to search out for those keywords for filtration.
In the below example, we have applied filtering on UserAgentHeader field along the OperationName and have kept the time range of 24 hours. The user agent shall help verifying if the operations were performed via Life cycle management policy. In case you are using classic logging, the field to check is User Agent.
By following the above 2 steps, although there is no direct metrics available for monitoring the lifecycle management stats however you can leverage the existing ones to narrow it down to some extent.
There are couple of more scenarios where in you can leverage or capitalize on this mechanism such as below:
Scenario 1: You have a rule for moving between one tier to another. Once you have validated the SetBlobTier is happening correctly, you can monitor the blob counts via metrics too to see the effects of the same.
Scenario 2: You have a rule for deletion of blob. Once you have validated the DeleteBlob operation is happening correctly, you can monitor the capacity or blob counts to see the effects of the same.
Scenario 3: For any kind of un-intentional deletion, you could monitor via above method to verify if the deletion happened via lifecycle management policy or something else.
Additional Pointers:
- Policy executes once in 24 hours so we shall keep the time window of min 24 hours for the assessment.
- In case you observe policy isn’t having affects there are couple of checks to evaluate such as correct prefix match (refer to FAQ link in the reference link section), base blob type shouldn’t be page blob etc.
- In case you observe policy is executing but the blobs aren’t getting not deleted completely over the path, please verify if there is multi-million blob scenario. If yes, in rare scenarios, it is quite possible that policy executes for a day and might not be able to process everything in single run. In that case, the remainder is processed in the subsequent runs so you might have to continue to monitor it for some time.
- Apart from using the available monitoring and logging, there is also LifecyclePolicyCompleted event which is triggered and give a high-level information regarding actions performed as part of the policy run. You can subscribe to this event as well and leverage it too.
Hope this helps!
Reference Links:
Optimize costs by automatically managing the data lifecycle - Azure Storage | Microsoft Learn
Monitoring Azure Blob Storage - Azure Storage | Microsoft Learn
Azure Blob Storage as Event Grid source - Azure Event Grid | Microsoft Learn
Frequently asked questions - Azure Blob Storage | Microsoft Learn
Published on:
Learn more