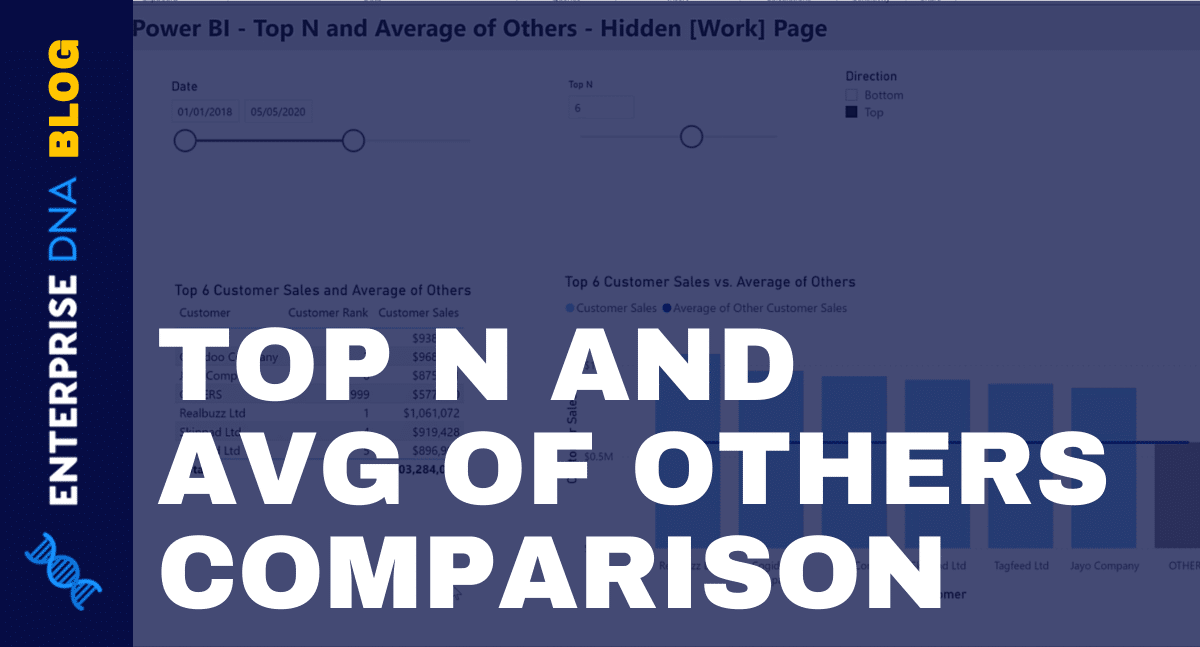
Comparison Of Values Between Top N And Average

This tutorial sheds light on the comparison of values between Top N and Average Of Others in Power BI. With this analysis technique, you can easily add directionality to your data insights by comparing how much the Top N and Bottom N customers exceed the average of the remaining customers.
This powerful visualization technique is a game-changer for data analysts and provides a clear direction for data-driven decision-making. The tutorial delves into the nitty-gritty of this technique, providing insights into the mechanics of the comparison of values between the Top N and Average Of Others in Power BI.
To access this valuable information, you can watch the full video tutorial via the link provided. Whether you are new to data analysis or an experienced practitioner, this tutorial is sure to add value to your skillset.
The post Comparison Of Values Between Top N And Average first appeared on Master Data Skills + AI.
Published on:
Learn moreRelated posts
Power BI Introduction Power BI Desktop | Power BI Service | Power Query | Data Modelling Data Visualization | Power BI Mobile Data Connectivity
Microsoft Power BI is a powerful and popular business intelligence and data visualization tool or suite developed by Microsoft. It enables use...
Data Visualization Technique in Power BI – Multi Measure Dynamic Visuals
In this blog post, you'll discover a powerful data visualization technique that will take your Power BI analysis to the next level — the...
First N Business Days Revisited – A DAX Coding Language Solution
In this tutorial, we take a fresh look at the problem of dynamically comparing the first N business days of each month and offer a DAX coding ...
Power BI Data Model For Advanced Scenario Analysis Using DAX
Discover the full potential of Power BI as an analytical tool with this tutorial focusing on developing a data model tailored for advanced sce...
Power BI Copilot: Enhancing Data Analysis with AI Integration
If you're looking for an intelligent assistant to help you navigate your data analysis, then Power BI Copilot is the tool you need. This innov...
Pandas AI: Data Analysis With Artificial Intelligence
Pandas, a popular Python library for data analysis, has just received a boost in the form of Pandas AI. This new addition enables Pandas to di...
How To Get Your Dataset’s Top N In Power BI
If you're looking to get the top N items in Power BI based on a specific metric, this informative blog is the perfect place to start. Using Qu...
Power BI Statistical Analysis Using The “Magic” Dataset Call
Are you looking to do advanced inferential Power BI statistical analysis with ease? Look no further than the "Magic" dataset call from Enterpr...
Business Intelligence Components and How They Relate to Power BI
This post explores Business Intelligence (BI) components and their relationship with Power BI. Delving into the history of Business Intelligen...
First look at Quick 'n' Easy Power BI inside Power Apps
This video provides viewers with a first-hand look at Quick 'n' Easy Power BI, an innovative tool inside Power Apps. Using this remarkable too...