Date Table in Power BI: Enhancing Your Data Analysis
Hey there! Are you looking to level up your data analysis game in Power BI? Well, you're in luck because we're about to dive into the wonderful world of date tables. In this article, we'll explore what a date table is, why it's crucial in Power BI, and how you can create and leverage it to unlock powerful insights in your data. So, let's get started!
Table of Contents
- What is a Date Table?
- The Importance of a Date Table in Power BI
- Creating Your Date Table
- Key Features and Benefits of a Date Table
- Utilizing the Date Table for Analysis and Reporting
- Best Practices for Implementing a Date Table
- Conclusion
- FAQs
What is a Date Table?
Imagine a central hub that holds all your dates in one convenient place. That's exactly what a date table is in Power BI. It's a dedicated table that houses a comprehensive list of dates, complete with attributes like Year, Month, Day, and Weekday. This table acts as a backbone for all your date-related calculations and provides a consistent framework for analyzing time-based data.
The Importance of a Date Table in Power BI
You might be wondering, "Why do I need a separate table just for dates?" Well, let us enlighten you! Here are some key reasons why a date table is vital in Power BI:
Consistency and Accuracy: With a dedicated date table, you ensure consistent and accurate date-related calculations across your reports and visualizations.Simplified Analysis: The date table simplifies complex time-based analysis by providing predefined hierarchies and attributes. You can effortlessly slice and dice your data by year, quarter, month, or day.
Effortless Filtering: Need to focus on specific time periods? The date table makes it a breeze to apply filters and select data for a particular month, quarter, or year.
Comparative Analysis: By leveraging the date table, you can easily compare data across different time periods, uncover trends, and spot patterns that might otherwise go unnoticed.
Seamless Integration: The date table establishes relationships with other tables, allowing for seamless integration and expanding the analytical capabilities of Power BI.
Now that you understand the importance of a date table, let's walk through the steps to create one in Power BI:
1. Open Power BI Desktop and head over to the "Modeling" tab.
2. Click on the "New Table" option, and it's time to define your date table's columns and attributes. Think Date, Year, Month, Day, and any other relevant attributes.
3. Populating the table with dates is the next step. You can use handy DAX functions like CALENDAR or CALENDARAUTO to generate the dates automatically.
4. Don't forget to customize your date table based on your specific needs. Add additional columns like Quarter, Week, or fiscal year to gain more granular insights and enable advanced calculations.
5. Establish relationships with other tables as needed to unlock the full potential of your date table.
Create a new Table
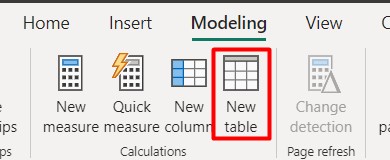
Open Power BI Desktop and head over to the "Modeling" tab. Click on the "New Table" option, and it's time to define your date table's columns and attributes.
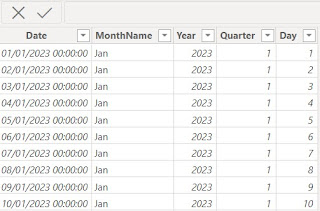
Once you created a new Table , you need to set the date range for the date table, this date range have to match with the date range of your data while filtering by using this date table. You can use handy DAX functions like CALENDAR or CALENDARAUTO to generate the dates automatically.The above DAX function creates a date table with a date column. in our example the date range i selected is between 2023-Jan-01 to 2023-Dec-31.
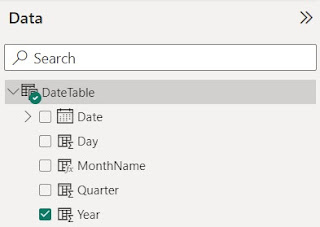
Other columns, such as Year, Month, Weekday, and Week of the Year, can be added to the table. To do so, select the New Column button on the ribbon and input the DAX equation for each column you want to add. In the following examples, we will write the DAX equation to get the year, month, and month numbers from the date table.
Year = YEAR(DateTable[Date])
Quarter = QUARTER(DateTable[Date])
MonthName = FORMAT(DateTable[Date],"mmm")
Day = DAY(DateTable[Date].[Date])
Utilizing the Date Table for Analysis and Reporting
Now that you have your date table set up, it's time to put it to good use! Here are some ways you can leverage the power of your date table for analysis and reporting:
Time-Based Filtering: Use the date table to easily filter your data based on specific time periods. Want to see sales data for the last quarter? Simply apply a filter, and voila! You have your desired results.
Here we have one sales table , you can map date table to the sales table by drag and drop the related column, in our example we can relate the Date column of date table to the invoice date of the sale table as whon in the below image.
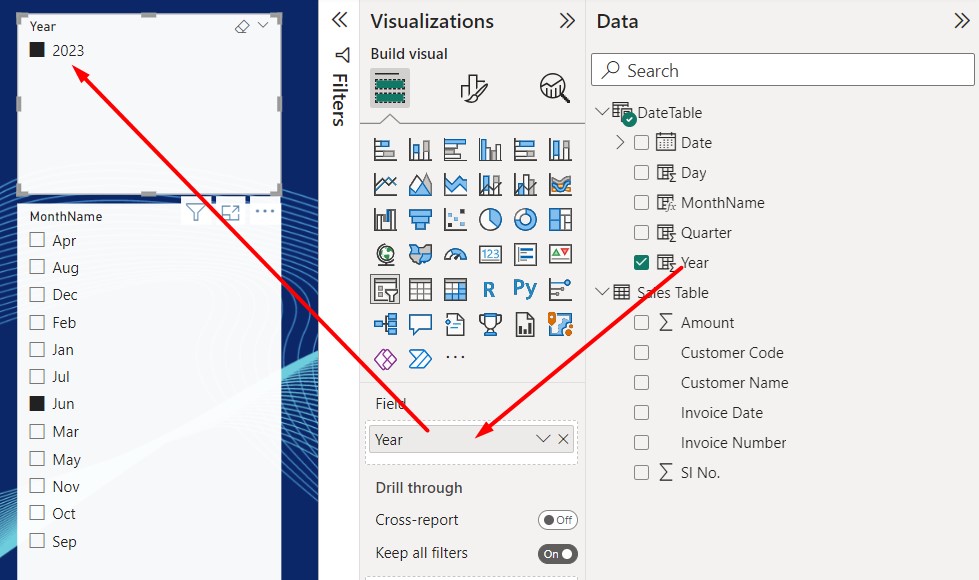
Once you completed this, open the report view tab from the left side and then add two slicer visuals Year and Month from the visualization tab, then right click on the year slicer and and then drag and drop the year column of the date table to the field property of the year slicer , similiarly right click on the month slicer and then drag and drop the MonthName column of the date table to the field property of the slicer Month. Now the filter is ready. This way you can add two filters (Year and Month) to Power BI dashboard.
Now the filter set up is ready, next step is add the required visuals or charts to the Power BI dashboard, in our example i added one card and stacked column chart visuals from visualizations tab. Basically Card visuals are used to show the summary in the dashboard reports . Other charts we can use as per the requirement.
Once you added the card in to the dashboreport view, drag and drop the amount column to the filed property of the card visual as shown in the below image.
similarly, drag and drop the the x-axis and y-axis values to the stacked column chart from the two tables as shown inthe image.
Now you can see the charts and summary dashboard repots are in the right side of the report view and filtering for month and year is in the left side of the repiort view.
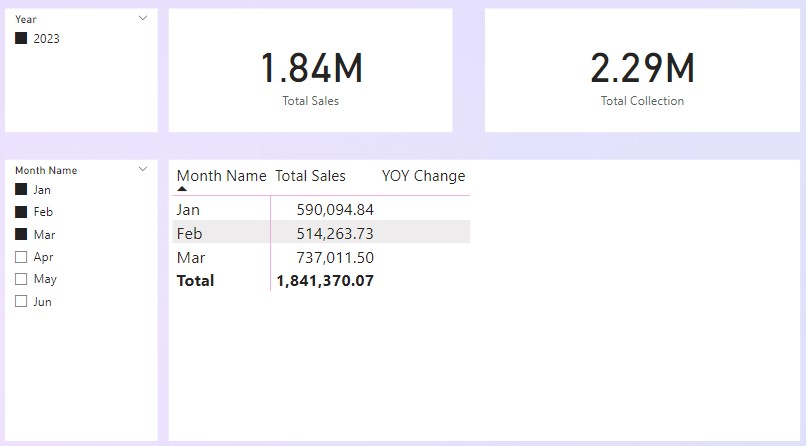
Here we are going to test the filtering by using date table , for this select Jan , Feb, March months from months slicer filter and 2023 from year filter slicer as shown in the below image
Conclusion
A date table is a powerful asset in Power BI that enhances your data analysis and reporting capabilities. By providing a centralized hub for all your date-related calculations, it brings consistency, accuracy, and flexibility to your analysis. With the ability to filter, compare, and drill down into your data, the date table unlocks valuable insights and empowers you to make data-driven decisions with confidence.
So, go ahead and create your date table in Power BI. Harness its potential, explore your data, and uncover hidden patterns and trends that will drive your business forward!
FAQs
1. Can I create a custom calendar in my date table? Absolutely! You can customize your date table by adding additional columns like Weekday, Week Number,
2. Can I use multiple date tables in a single Power BI model? Yes, you can use multiple date tables in a single Power BI model. This can be useful when dealing with different types of date-related data, such as transaction dates and delivery dates. Just ensure that you establish the appropriate relationships between the date tables and other relevant tables.
3. Do I need a date table for every date column in my data? It's not necessary to create a separate date table for every date column in your data. However, having a centralized date table is recommended for consistency and ease of analysis. You can establish relationships between the date table and other tables that contain date columns to leverage its functionality across the entire data model.
4. Can I customize the format of dates in my date table? Absolutely! Power BI allows you to customize the format of dates in your date table. You can choose from a variety of date formats, such as dd/mm/yyyy or mm/dd/yyyy, based on your regional preferences or specific reporting requirements.
5. What happens if my date table doesn't cover the entire range of dates in my data? If your date table doesn't cover the entire range of dates in your data, it can lead to inconsistencies and inaccurate analysis. It's important to ensure that your date table includes all relevant dates and is regularly updated to accommodate new data.
6. Can I add calculated columns to my date table? Absolutely! You can add calculated columns to your date table to enhance its functionality. For example, you can calculate the fiscal quarter, financial year, or other custom attributes based on your business requirements. These calculated columns can then be used in your analysis and reporting.
Remember, the date table is a powerful tool in Power BI that enables efficient and insightful data analysis. By understanding its importance and leveraging its features, you can unlock the full potential of your data and make more informed business decisions.
Published on:
Learn moreRelated posts
Power BI, Parallelism And Dependencies Between SQL Queries In DirectQuery Mode
This is going to sound strange, but one of the things I like about tuning Power BI DirectQuery semantic models is that their generally-slower ...
Creating Engaging, Animated Line Charts in Power BI with Custom Visuals
Power BI provides powerful built-in visuals, but sometimes you need custom behavior—such as animated line transitions when filters change. In ...
Generate ERD diagrams for your Power BI Semantic Model using GitHub Copilot
While preparing for a training day I will host early March, I was doing some experiments in VS Code with GitHub Copilot and a few related exte...

