Azure VMware Solution - Using Log Analytics With NSX-T Firewall Logs
Azure VMware Solution
How To Series: Monitoring Azure VMware Solution
Overview
Requirements
Lab Environment
Tagging & Groups
Kusto for NSX-T Logs
Overview
Many Azure VMware Solution customers are new to NSX-T. This blog uses an example to show how to configure NSX-T firewall rules and then use Log Analytics for troubleshooting and alerting. The focus is on restricting NSX-T East-West traffic by creating tags and groups and using these in the development of rules that we can then easily query in Azure Log Analytics.
Requirements
- Access to the NSX-T console, in this case we use the default cloudadmin account.
- A log analytics workspace to store the logs.
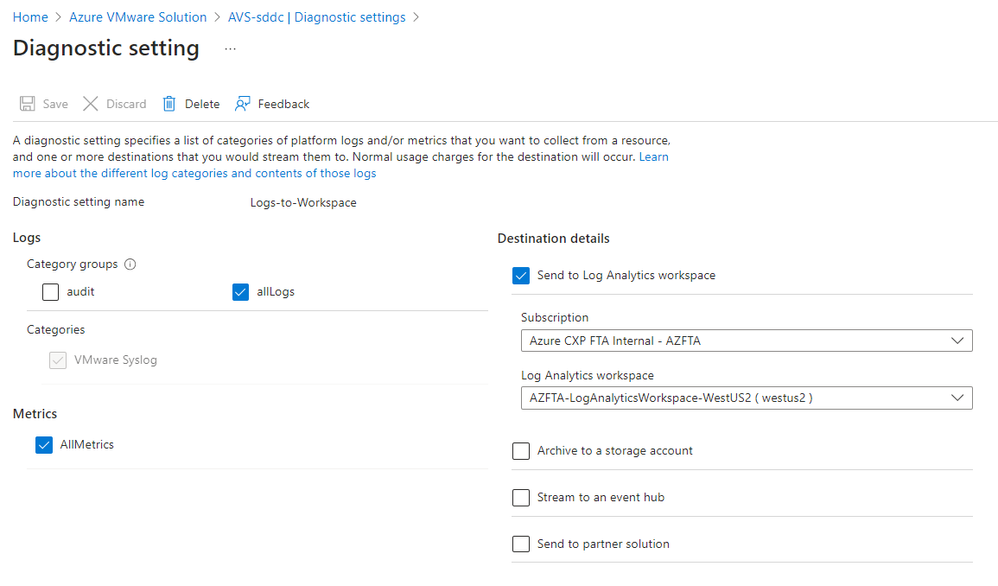
- The diagnostics settings enabled for Azure VMware Solution and configured with the log analytics workspace name and 'All logs' selected. (Audit logs are the actions that privileged users take on the Azure VMware Solution private cloud).
Figure 1: Azure VMware Solution Diagnostics Settings
Lab Environment
The routes between vLAN segments in the Azure VMware Solution (AVS) are by default open; both between each other (East – West) and for traffic into and out of AVS. Depending on your approach, you can either set rules to 'Allow', 'Drop', or 'Reject' (application layer). Once the rule set is built the default layer 3 rule will be changed to 'Drop'.
The lab environment consists of 4 network segments. The network segments VLAN-1 and VLAN-2 contain the web app, segment VLAN-3 contains the application servers, and segment VLAN-4 contains the backend servers. The NSX-T Firewall will be configured to allow traffic from servers in vLAN-1 and vLAN-2 to servers in vLAN-3. vLAN-3 must be able to connect to vLAN-4 and not be able to connect and servers in vLAN-1 or vLAN-2. vLAN-4 should not be able to connect to vLAN-1, vLAN-2 or vLAN3. .
Figure 2: NSX-T logging lab environment
The firewall traffic matrix looks like this:
|
Segment |
AVS-VLAN-1 |
AVS-VLAN-2 |
AVS-VLAN-3 |
AVS-VLAN-4 |
|
AVS-VLAN-1 |
n/a |
Block |
Allow |
Block |
|
AVS-VLAN-2 |
Block |
n/a |
Allow |
Block |
|
AVS-VLAN-3 |
Block |
Block |
n/a |
Allow |
|
AVS-VLAN-4 |
Block | Block |
Block |
n/a |
Tagging & Groups
Step 1: Create tags for each of the servers
Login to the NSX-T console and click on Inventory then select Tags, and then ADD TAG. Enter the name of the server ‘AppServer-01’ (we are keeping it simple here), set the Scope as ‘Server Type’ and then click on ‘Set Virtual Machines’.
Note: ‘Tag scope’ is not required for this demo. This field is analogous to a key and ‘tag name is analogous to a value’. For example, let us say, you want to label all virtual machines based on their operating system (Windows, Mac, Linux). You can create three tags, such as Windows, Linux, and Mac, and set the scope of each tag to OS. Other examples of tag scope can be tenant, owner, name, and so on. Finally click on the 'Set Virtual Machines' and add the tag to a specific machine. Then click Save.
Figure 3: Adding tags to servers
For example, click-on ‘Set Virtual Machines’ , select the virtual machine AppServer-01, then click ‘APPLY’ in the bottom right hand corner.
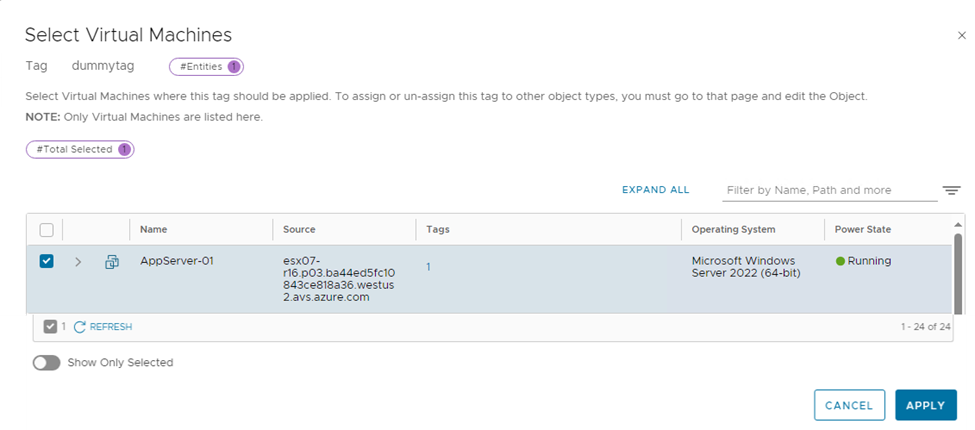
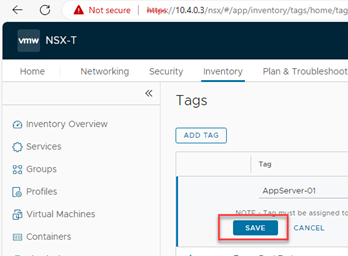
Now click on Save to complete the process to attach a tag to a virtual machine.
Figure 5: Completing the tag attach to a virtual machine.
The process is repeated for the other 5 machines so we end up with the following.
Figure 6: Tags created and assigned to servers
Step 2: Create Groups based on tags
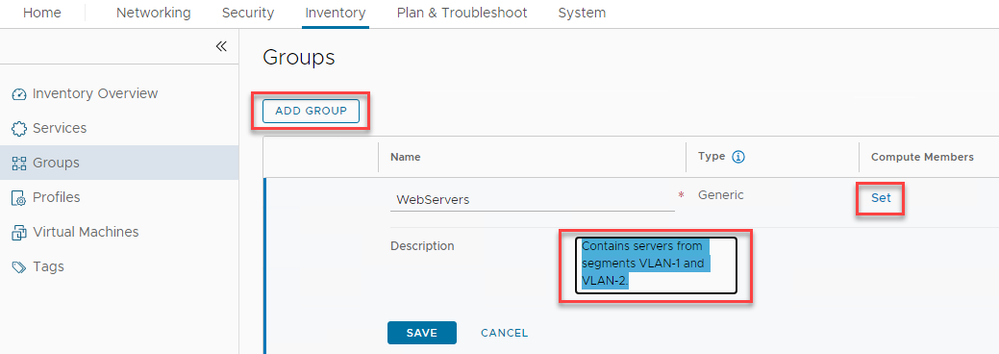
Select Inventory then select Groups and click on ‘ADD GROUP’. Create a group with the name “WebServers” and a description “Contains servers from vLAN-1 and vLAN-2” , then click on ‘Set’.
Figure 7: Creating groups
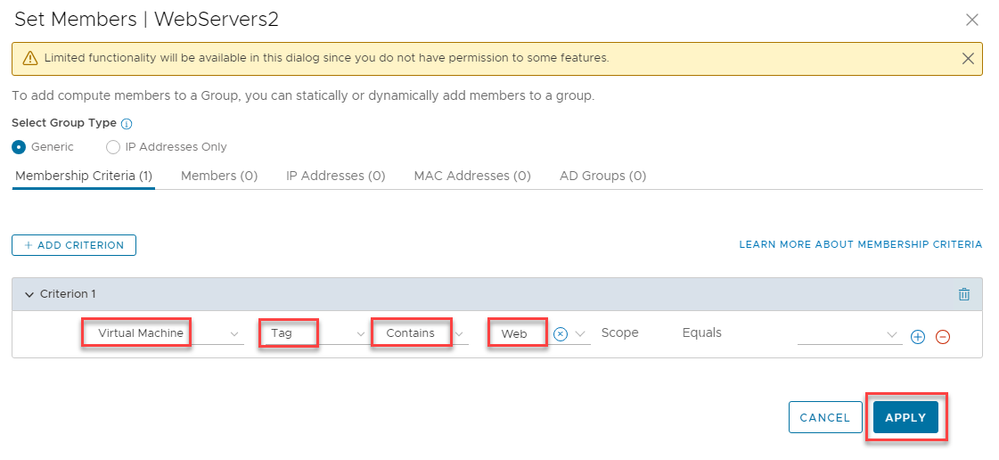
In the Set Members page, leave the ‘Select Group Type’ as Generic and click on “+ Add Criterion” and select ‘Tag’ , the select 'Contains' and then enter Web. Next click on 'APPLY'.
Figure 8: Creating Groups based on server the server Tag
Repeat the process for the AppServers and BackEndServers. Once complete the following groups should exist.
Note: Use the 'View Members' link to check that each group contains the correct servers.
Figure 9: Groups containing relevant servers.
Step 3: Create rules based on groups
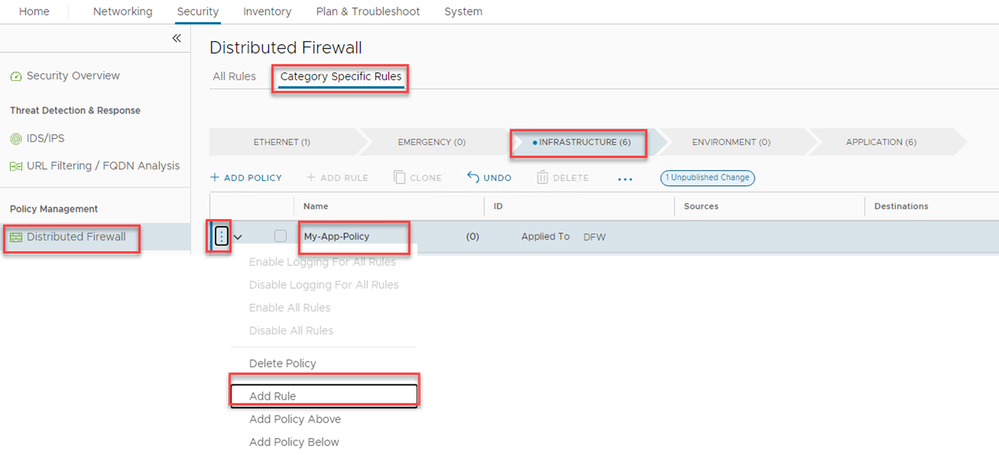
Click on ‘Security’ and ‘Distributed Firewall’, 'Category Specific Rules' , select the 'Infrastructure' tab, and then “ADD POLICY”. A ‘New Policy’ will appear as a new line, rename the policy My-App-Policy, then click on the 3 ellipses, and select ‘Add Rule’.
Figure 10: Add a new policy and add a rule
Rename the New Rule to ‘Allow-WebServers-To-AppServers’ , then fill in the Sources ‘Webservers’, Destination ‘AppServers’ and Services ‘HTTPS’ + ICMPv4-All’ (ICMP is just for testing). Leave the Action as ‘Allow’ , the click on the gear icon on the far right.
Figure 11: Creating a new rule under the My-App-Policy
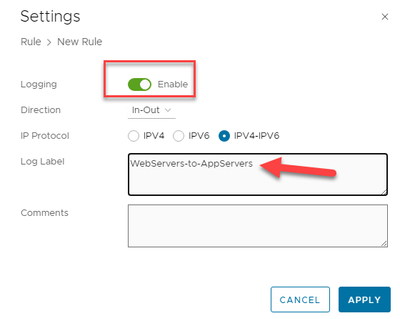
In the rule Setting screen, enable logging, and enter the name of the rule in the log label. This is the label we will see later in the Log Analytics results when we run a Kusto query.
Figure 12: Setting the Log Label for the rule.
Repeat the process for each rule required to meet the connectivity matrix requirements defined above, be sure to add name of the rule to the Log Label. The end result should look like the following. Note that for the WebServers-to-BackEndServers the action has been set to 'Reject', the 'Drop' option can also be used. There is a difference in the ping response.
Click on 'PUBLISH' to write the policy and it's rule set.
Figure 13: Final rule set configuration
Switch to the APPLICATION tab and open up the Default Layer 3 Section. Note this rule is always on, so when the NSX-T is first installed, the default is to allow all layer 3 traffic. Switch the Action to 'Drop' and then click on 'PUBLISH' to update the policy.
Figure 14: Changing the default Application layer rule to drop.
Step 3: Testing Connectivity
Now test the connections between the servers to ensure that connectivity is behaving as expected.
WebServers servers to other servers. Note that each machine in this case has the following Hosts file additions, rather than using specific IP addresses.
Host File
192.168.101.10 webserver-01
192.168.102.10 webserver-02
192.168.103.13 appserver-01
192.168.103.17 appserver-02
192.168.104.13 backend-01
192.168.104.17 backend-02
Webserver-01 to WebServer-02, AppServers and to BackEndServers groups.
Figure 15: Expected behavior of traffic from WebServer-01 (Note: Webserver-01 and -02 are on different segments)
AppServer-01 to WebServer-01 and to BackEndServers group
Figure 16: Expected behavior from AppServer-01 to WebServers and BackEndServers groups
BackEndServer-01 to WebServers and BackEndServers groups
Figure 17: Expected behavior from the BackEndServer-01 to the WebServers and AppServers groups
Kusto for NSX-T Logs
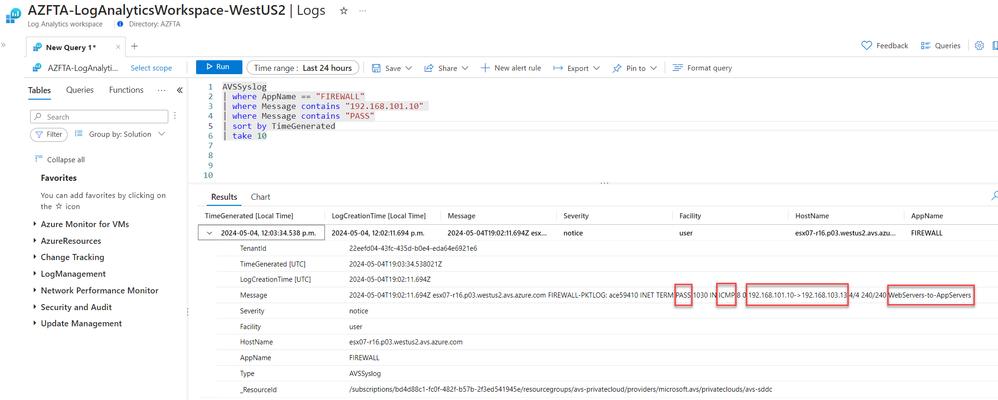
Open up the log analytics space selected in step 1 and add the following Kusto query to a new tab.
AVSSyslog
| where AppName == "FIREWALL"
| where Message contains "192.168.101.10" and Message contains "PASS"
| sort by TimeGenerated
| take 10
This will show the most recent 10 logs that have a message in the syslog that contains both the source and IP address. This simple query is very powerful and clearly demonstrates why the tags are important in identifying which rule has been triggered. The syslog 'Message' contains the PASS effect of the rule (PASS or DROP or REJECT), the protocol used, the IP source and destination and the rule that triggered the log.
Figure 18: Kusto query example 1; PASS - allowing traffic from WebServer-01 to AppServer-01
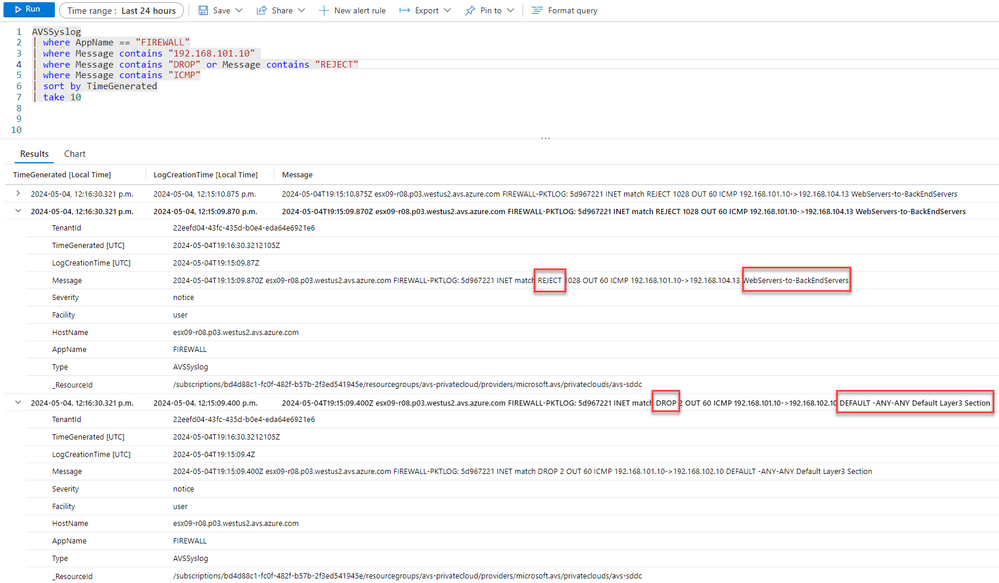
In the screenshot below, we can see that the WebServer-01 to BackEndServer-01 the rule 'WebServers-to-BackEnd Servers has a 'REJECT' that is blocking traffic (as expected). However for the WebServer-01 to WebServer-02, this traffic is being blocked by the Default layer 3 rule (found under the Applications tab). This is because unlike WebServers-to-BackEndServers rule, there is no explicit rule blocking traffic between WebServer-01 and WebServer-02
Figure 19: Kusto query example 2; DROP, traffic blocked between WebServer-01 to WebServer-02 and the BackEndServer-01
Concluding Remarks
The key message here is to use tagging and log labelling to facilitate the use of NSX-T firewall rules and simplify the ability to find which rules are being triggered using Kusto. Note that Kusto can be used to create more simplified specific data outputs rather than the raw data shown here.
Tips & Tricks
- Ensure that when you change the default layer 3 rule to 'Drop' that you have created a rule to enable DHCP so your client VM's can get an IP address.
- Whenever you create a rule, add the log label.
- Turn on logging when you need to trouble shoot, otherwise a large amount of data will be stored in log analytics, and that can become expensive.
References:
Configure VMware syslogs for Azure VMware Solution: https://learn.microsoft.com/en-us/azure/azure-vmware/configure-vmware-syslogs
NSX-T Log messages and error codes: https://docs.vmware.com/en/VMware-NSX/4.1/administration/GUID-406AF9C3-E8F7-447A-8E3D-92AFB9D5E973.html
Tags in NSX-T: https://docs.vmware.com/en/VMware-NSX-T-Data-Center/3.2/administration/GUID-358DF469-75C8-48C4-B0E2-279E55C7BB3E.html
Published on:
Learn moreRelated posts
Introducing langchain-azure-cosmosdb: Build Agentic Apps and RAG with One Database
Build AI Agents and RAG Applications with the New LangChain + LangGraph Connector for Azure Cosmos DB Building AI agents and RAG applications ...
Azure Developer CLI (azd) – April 2026
The Azure Developer CLI (azd) shipped five releases in April 2026. The biggest theme this month is multi-language hook support: write azd hook...
Dynamics 365 Supply Chain Management – Run Planning Optimization on Azure operated by 21Vianet
We are announcing the ability for companies in China running Dynamics 365 Supply Chain Management on Azure operated by 21Vianet to run Plannin...
Announcing the Private Preview of Cosmos DB Azure RBAC Integration
Introduction Managing access to Azure resources often means dealing with two separate permission models: one for management operations and ano...
Azure DocumentDB (with MongoDB compatibility) for Banking: A Modern Customer 360 Approach
Introduction: Transforming Customer Intelligence in Banking Every day, people interact with their bank across mobile apps, branches, call cent...
Exam AI-901: Microsoft Azure AI Fundamentals
With a massive amount of focus on AI across the Microsoft platform, I decided to sit the new AI-901 exam, which is the new Azure fundamentals ...
The problem: All-or-nothing batch processing in Azure Service Bus
Azure Functions lets you settle each Service Bus message on its own within a batch. Complete, abandon, dead-letter, or defer messages one by o...
Welcome to Azure Cosmos DB Conf 2026
Today is the day. Azure Cosmos DB Conf 2026, in partnership with AMD, is a free virtual developer event focused on building modern, scalable a...
Azure Data Studio is retired: Move your Azure SQL workflow to VS Code in 10 minutes
Azure Data Studio retired on February 28, 2026. The recommended path forward is Visual Studio Code with the MSSQL extension. If you used ADS d...
