Optimizing Java Workloads on Azure General Purpose D-series v5 VMs with Microsoft’s Build of OpenJDK

Introduction
In today's competitive environment, optimizing the performance of virtual machines (VMs) for various workloads is crucial. Continuing from our first blog, `Scaling Azure Arm64 VMs with Microsoft’s Build of OpenJDK: A Performance Testing Journey`, the Java Engineering Group (JEG) at Microsoft recently extended its analysis to Azure D-series v5 (general purpose) Ampere Altra, AMD EPYC, and Intel Ice Lake VMs.
We aimed to leverage the full potential of these VMs running Java-based workloads on Microsoft's Build of OpenJDK JDK 17, utilizing the SPECjbb2015 benchmark as a capacity planning tool. This benchmark enabled us to drive sustained bandwidth and critical throughput (under SLA constraints) at each scale (2 to 64 cores), leading to optimizations of certain JVM features for Azure VMs.
We found that Azure D-series v5 x86-64-based VMs, including Intel Ice Lake and AMD EPYC, behaved similarly. Hence, we talk about them in a group versus Arm64 VM. This similarity in behavior is evident when using benchmarks like SPECJBB2015 for capacity planning, as these benchmarks scale similarly on similar ISAs.
This blog post will discuss key insights and recommendations from this process.
Methodology
The performance testing of Ampere Altra, Intel Ice Lake, and AMD EPYC VMs with Microsoft’s Build of OpenJDK was carried out using a robust methodology that includes standardized scripts, tuned runs, JVM-specific tuning, and industry benchmarks, all designed to effectively drive load on the JVM and maximize the utilization of available CPU and memory for each configuration.
This methodology, as well as the testing configuration and benchmarking environment, is detailed in the first part of this series. We recommend referring to it, especially the `Test Details` and the `JVM-specific tuning` sections, for a deeper understanding of the approach.
This follow-up blog will focus on our observations and conclusions from the testing process, analyzing how Arm64 and x86-64 VMs performed under these configurations.
Key Takeaways
Improved Performance with JVM Command Line Tuning
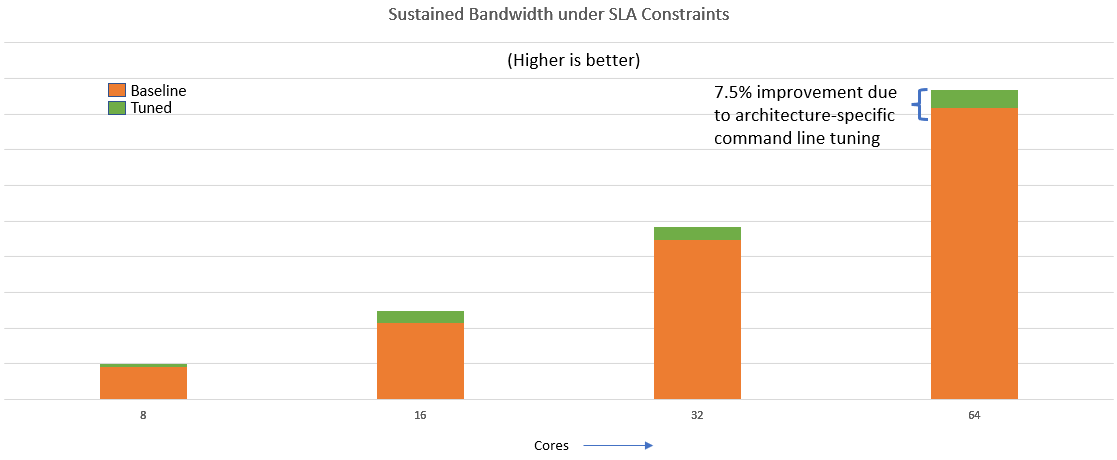
Our comparison of SPECJBB2015 baseline (with just the heap and nursery sizes and no adaptive sizing) to tuned JVM-command line scores indicated that up to 7.5% performance improvement can be achieved through JVM command line tuning when using Microsoft's Build of OpenJDK on Azure D-series v5 Arm VMs. Arm processors require different sizing and prefetching defaults compared to x86-64 (Intel Ice Lake and AMD EPYC), so paying attention to these settings when optimizing performance on Arm64 architectures is crucial.
The need for additional tuning on Arm VMs can be attributed to the relatively recent introduction of Arm64 processors in the server market, a topic we touched upon in our previous blog `Scaling Azure Arm64 VMs with Microsoft’s Build of OpenJDK: A Performance Testing Journey`. The JVM and the JDK have been extensively optimized for x86-64 systems over the years, and only recently have efforts been made to provide tuned out-of-the-box defaults for Arm64 processors. As a result, users of Azure D-series v5 Arm VMs should invest time in JVM command line tuning to ensure they achieve the best possible performance for their Java-based workloads.
Optimizing Workloads for Enhanced Performance
For workloads such as SPECjbb2015, workload-specific tuning can lead to significant performance improvements on Azure D-series v5 Arm VMs using Microsoft's Build of OpenJDK. Our tests showed up to an 18% improvement in `sustained bandwidth under SLA constraints` compared to a maximum of 7% on x86-64 systems (Intel Ice Lake and AMD EPYC) for the same. This difference can likely be attributed to the recent introduction of Arm64-based processors to the server market. Consequently, benchmarks and several applications may need to be re-tuned to fully exploit the dedicated core per vCPU feature Azure Arm VMs offer.
To achieve these gains, we tailored the settings of fork-join pools and various queues for each core-heap combination, scaling them accordingly. By fine-tuning these settings, users can optimize the performance of their Java-based workloads on Azure D-series v5 Arm VMs and fully leverage the benefits of Arm64 architecture. These tunings are specifically advantageous for workloads that depend on large-scale thread pool coordination, such as a gaming workload that delivers an immersive gaming experience to their users.
Core Scaling Comparison across VM Architectures
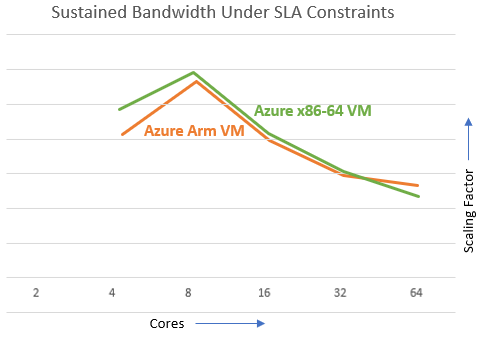
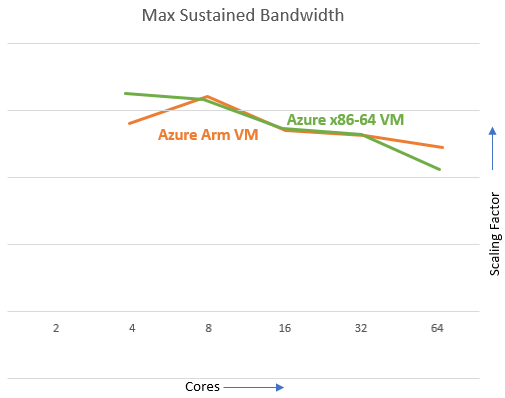
Below you will find the graphs highlighting the scaling factor for cores 4 to 64. Our core scaling comparison graph demonstrates that Azure D-series v5 x86-64 VMs, and tuned Arm VMs exhibit closely tracking scaling behavior from 2 to 64 cores running with Microsoft's Build of OpenJDK.
Both x86-64-based VMs (Intel Ice Lake and AMD EPYC) and tuned Arm VMs show similarly varying scaling results for sustained bandwidth under SLA constraints and maximum sustained bandwidth across different core configurations. These results were obtained with Turbo Boost disabled and Transparent HugePages enabled on all systems.
This comparison highlights the importance of understanding the differences in performance characteristics when optimizing Java-based workloads for Azure Arm architecture. By understanding these distinctions and adjusting settings accordingly, users can achieve the best performance possible for their specific Azure VM architecture and Java workloads.
The Impact of Transparent HugePages on Throughput
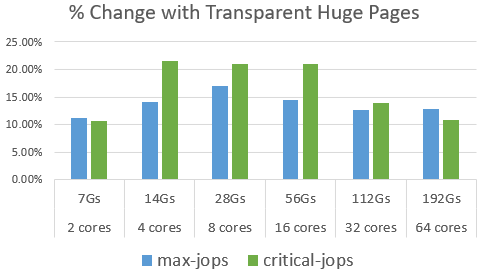
Azure x86-64 VMs (Note: A positive % change means Transparent Huge Pages were beneficial):
Azure Arm64 VMs (Note: A positive % change means Transparent Huge Pages were beneficial):
Our study shows that enabling Transparent HugePages on Azure D-series v5 Intel Ice Lake, AMD EPYC, and Ampere Altra VMs can significantly improve performance when using Microsoft's Build of OpenJDK. For Azure x86-64 VMs, we observed up to a 21% boost in critical throughput (under SLA constraints) and up to a 17% increase in maximum (sustained) throughput. In comparison, Azure Arm VMs experienced up to a 17% boost in critical throughput and up to a 14.5% increase in maximum (sustained) throughput.
These findings highlight the importance of considering Transparent HugePages as a performance optimization strategy for large-scale, data-intensive JVM-based applications hosted on Azure VMs interacting with a Java-based NoSQL database to manage and process the high volume. Without Transparent HugePages (THP), the application might experience performance bottlenecks due to frequent page faults and the overhead of managing many small pages in memory. This could slow down data processing and impact the company's ability to provide real-time services to its users or clients. By enabling this feature, users can improve the performance of memory-intensive operations, contributing to better overall throughput.
Benefits of Compressed Oops with 16-byte Offset on Arm VMs
Leveraging Compressed Oops (Ordinary Object Pointers) with a 16-byte offset can offer significant advantages on Arm VMs in Azure's D-series v5. Compressed Oops is a JVM optimization technique that compresses references (instead of using full 64-bit pointers), thus reducing the Java heap footprint and improving performance, particularly for heaps under 32GB. Utilizing a 16-byte offset allows the JVM to address a larger heap space while benefiting from reference compression.
Interestingly, this performance enhancement was not mirrored on x86-64 systems (like Intel Ice Lake and AMD EPYC). This suggests that for workloads on Azure Arm VMs with Java heaps up to 64GB; it could be advantageous to experiment with enabling compressed Oops with a 16-byte offset to maximize performance.
However, it's important to note that increasing the offset indiscriminately can lead to memory wastage. This is because the larger offset effectively reduces the granularity of memory that can be addressed. Each offset points to a 16-byte aligned address rather than an 8-byte aligned address as with the default Compressed Oops. Therefore, thorough testing and validation should be performed to balance performance gains and resource utilization.
Consider a company dealing with real-time predictive analytics for retail businesses, which processes large volumes of transactions and customer data. The expanded heap range offered by Compressed Oops with a 16-byte offset could help process data more efficiently, thereby improving the efficiency and responsiveness of their analytics platform.
Conclusion
Our investigations on Azure D-series v5 Ampere Altra, Intel Ice Lake, and AMD EPYC VMs demonstrate the potential for significant performance improvements when using Microsoft's Build of OpenJDK. These improvements can be achieved by enabling Transparent HugePages, adjusting application-specific settings, and implementing command line tuning.
The benefits of these optimizations extend to various real-world applications. Consider e-commerce platforms during peak shopping seasons. These websites handle high volumes of traffic, potentially leading to performance bottlenecks. By optimizing JVM features and tuning workloads according to our findings, they can enhance performance, effectively handle increased traffic, and ensure seamless operation during peak times.
Beyond e-commerce, any business operating Java-based workloads on Azure D-series v5 VMs can capitalize on these insights. Whether you're running large-scale data processing tasks, managing a sophisticated online gaming platform, or deploying a complex enterprise application, understanding and implementing these optimizations can lead to tangible performance improvements.
Our research highlights the importance of customizing optimizations based on specific VM architecture. For instance, on Azure Arm VMs with heaps under 64GB, using compressed Oops with a 16-byte offset provides performance benefits not seen on x86-64 systems. Understanding these differences between x86-64 and Arm architecture enables us to effectively fine-tune Java-based workloads on Azure Arm VMs.
Appendix
Performance tuning for the JVM and applications is highly dependent on your application's behavior, the JVM's response to your application's behavior, and the characteristics and specifications of the underlying cloud hardware. The optimal settings in each tuning category will depend on these factors. If you need clarification on making these changes, we recommend consulting with performance engineering experts with deep JVM understanding. Any changes should be thoroughly tested in a representative environment before considering deployment into production. Here is some general guidance:
InlineSmallCode: This parameter is critical to inlining optimization and specifies the maximum byte size of a small compiled method that can be inlined. The default value is typically 2000 bytes in 64-bit JVM. As for testing, you could experiment with a wide range, from 500 to 5000 bytes. Tighter values will restrict inlining to smaller methods, reducing the amount of generated code. In comparison, larger values allow more aggressive inlining, potentially improving performance at the cost of increased memory usage and compilation times. Monitor code cache usage and the time spent on JIT compilation while tuning this parameter.
AllocatePrefetchLines: This parameter controls the number of cache lines to prefetch ahead of time. Default values are platform-specific and may not be enabled by default on some platforms. For tuning, start from zero (disabling software prefetching) up to 64. However, the practical maximum value would depend on the cache size of the specific CPU you're using. Increasing this value could improve throughput for data-heavy workloads, but over-aggressive prefetching can cause unnecessary cache pollution. Monitor cache miss rates and overall CPU utilization when tuning this option.
TypeProfileWidth: This parameter tunes the call profiling in the JVM and specifies the number of receiver types the JVM will track for each call site. The default value is typically 2 in server JVMs. For performance testing, consider a range from 1 up to 8. Lower values limit the profiling overhead, which might benefit workloads with highly polymorphic call sites. Higher values allow the JVM to gather more detailed profiling information and generate more optimized code at the expense of increased CPU and memory overheads during profiling and compilation. Monitor method compilation times, CPU utilization, and application-level performance metrics when tuning this parameter.
Always remember that tuning is an iterative process, and the optimal values depend on many factors specific to your application and infrastructure. Establishing performance baselines, careful monitoring, systematic testing, and an in-depth understanding of your application behavior and the JVM are paramount to successful tuning. The key to effective performance tuning lies in meticulously observing the impact of each change, enabling you to fine-tune settings for optimal application performance.
Published on:
Learn moreRelated posts
Fabric Mirroring for Azure Cosmos DB: Public Preview Refresh Now Live with New Features
We’re thrilled to announce the latest refresh of Fabric Mirroring for Azure Cosmos DB, now available with several powerful new features that e...
Power Platform – Use Azure Key Vault secrets with environment variables
We are announcing the ability to use Azure Key Vault secrets with environment variables in Power Platform. This feature will reach general ava...
Validating Azure Key Vault Access Securely in Fabric Notebooks
Working with sensitive data in Microsoft Fabric requires careful handling of secrets, especially when collaborating externally. In a recent cu...
Azure Developer CLI (azd) – May 2025
This post announces the May release of the Azure Developer CLI (`azd`). The post Azure Developer CLI (azd) – May 2025 appeared first on ...
Azure Cosmos DB with DiskANN Part 4: Stable Vector Search Recall with Streaming Data
Vector Search with Azure Cosmos DB In Part 1 and Part 2 of this series, we explored vector search with Azure Cosmos DB and best practices for...
General Availability for Data API in vCore-based Azure Cosmos DB for MongoDB
Title: General Availability for Data API in vCore-based Azure Cosmos DB for MongoDB We’re excited to announce the general availability of the ...
Efficiently and Elegantly Modeling Embeddings in Azure SQL and SQL Server
Storing and querying text embeddings in a database it might seem challenging, but with the right schema design, it’s not only possible, ...


