Few platform logs and metrics go missing when streaming them from Diagnostic Setting to Event Hub...

Issue: Few platform logs and metrics go missing when streaming them from Diagnostic Setting to Event Hub especially when Event Hub is Throttling.
Scenario: Using Diagnostic setting users route platform logs and metrics to Azure Event Hub (EH). These events are consumed by partner SIEM and Monitoring tools. At times users complain that events that occurred in the system or certain metrics\logs\traces has not reached the Event Hub.
Validation:
- Validate if the event\metric\log has been generated by the platform\application. Also check if the Diagnostic setting is properly configured to route the data to correct Event Hub.
- Configure alternative diagnostic pipeline to Azure Log Analytics (LA) or Azure Storage. If you see the events in LA or Storage, but not in EH you know that the data is generated but is not routed to EH. (This is the issue).
- The fact that consumer application like SIEM and Monitoring tool does not see the event does not always mean that event has not reached the EH (negative validation). The consumer application may not be reading the events.
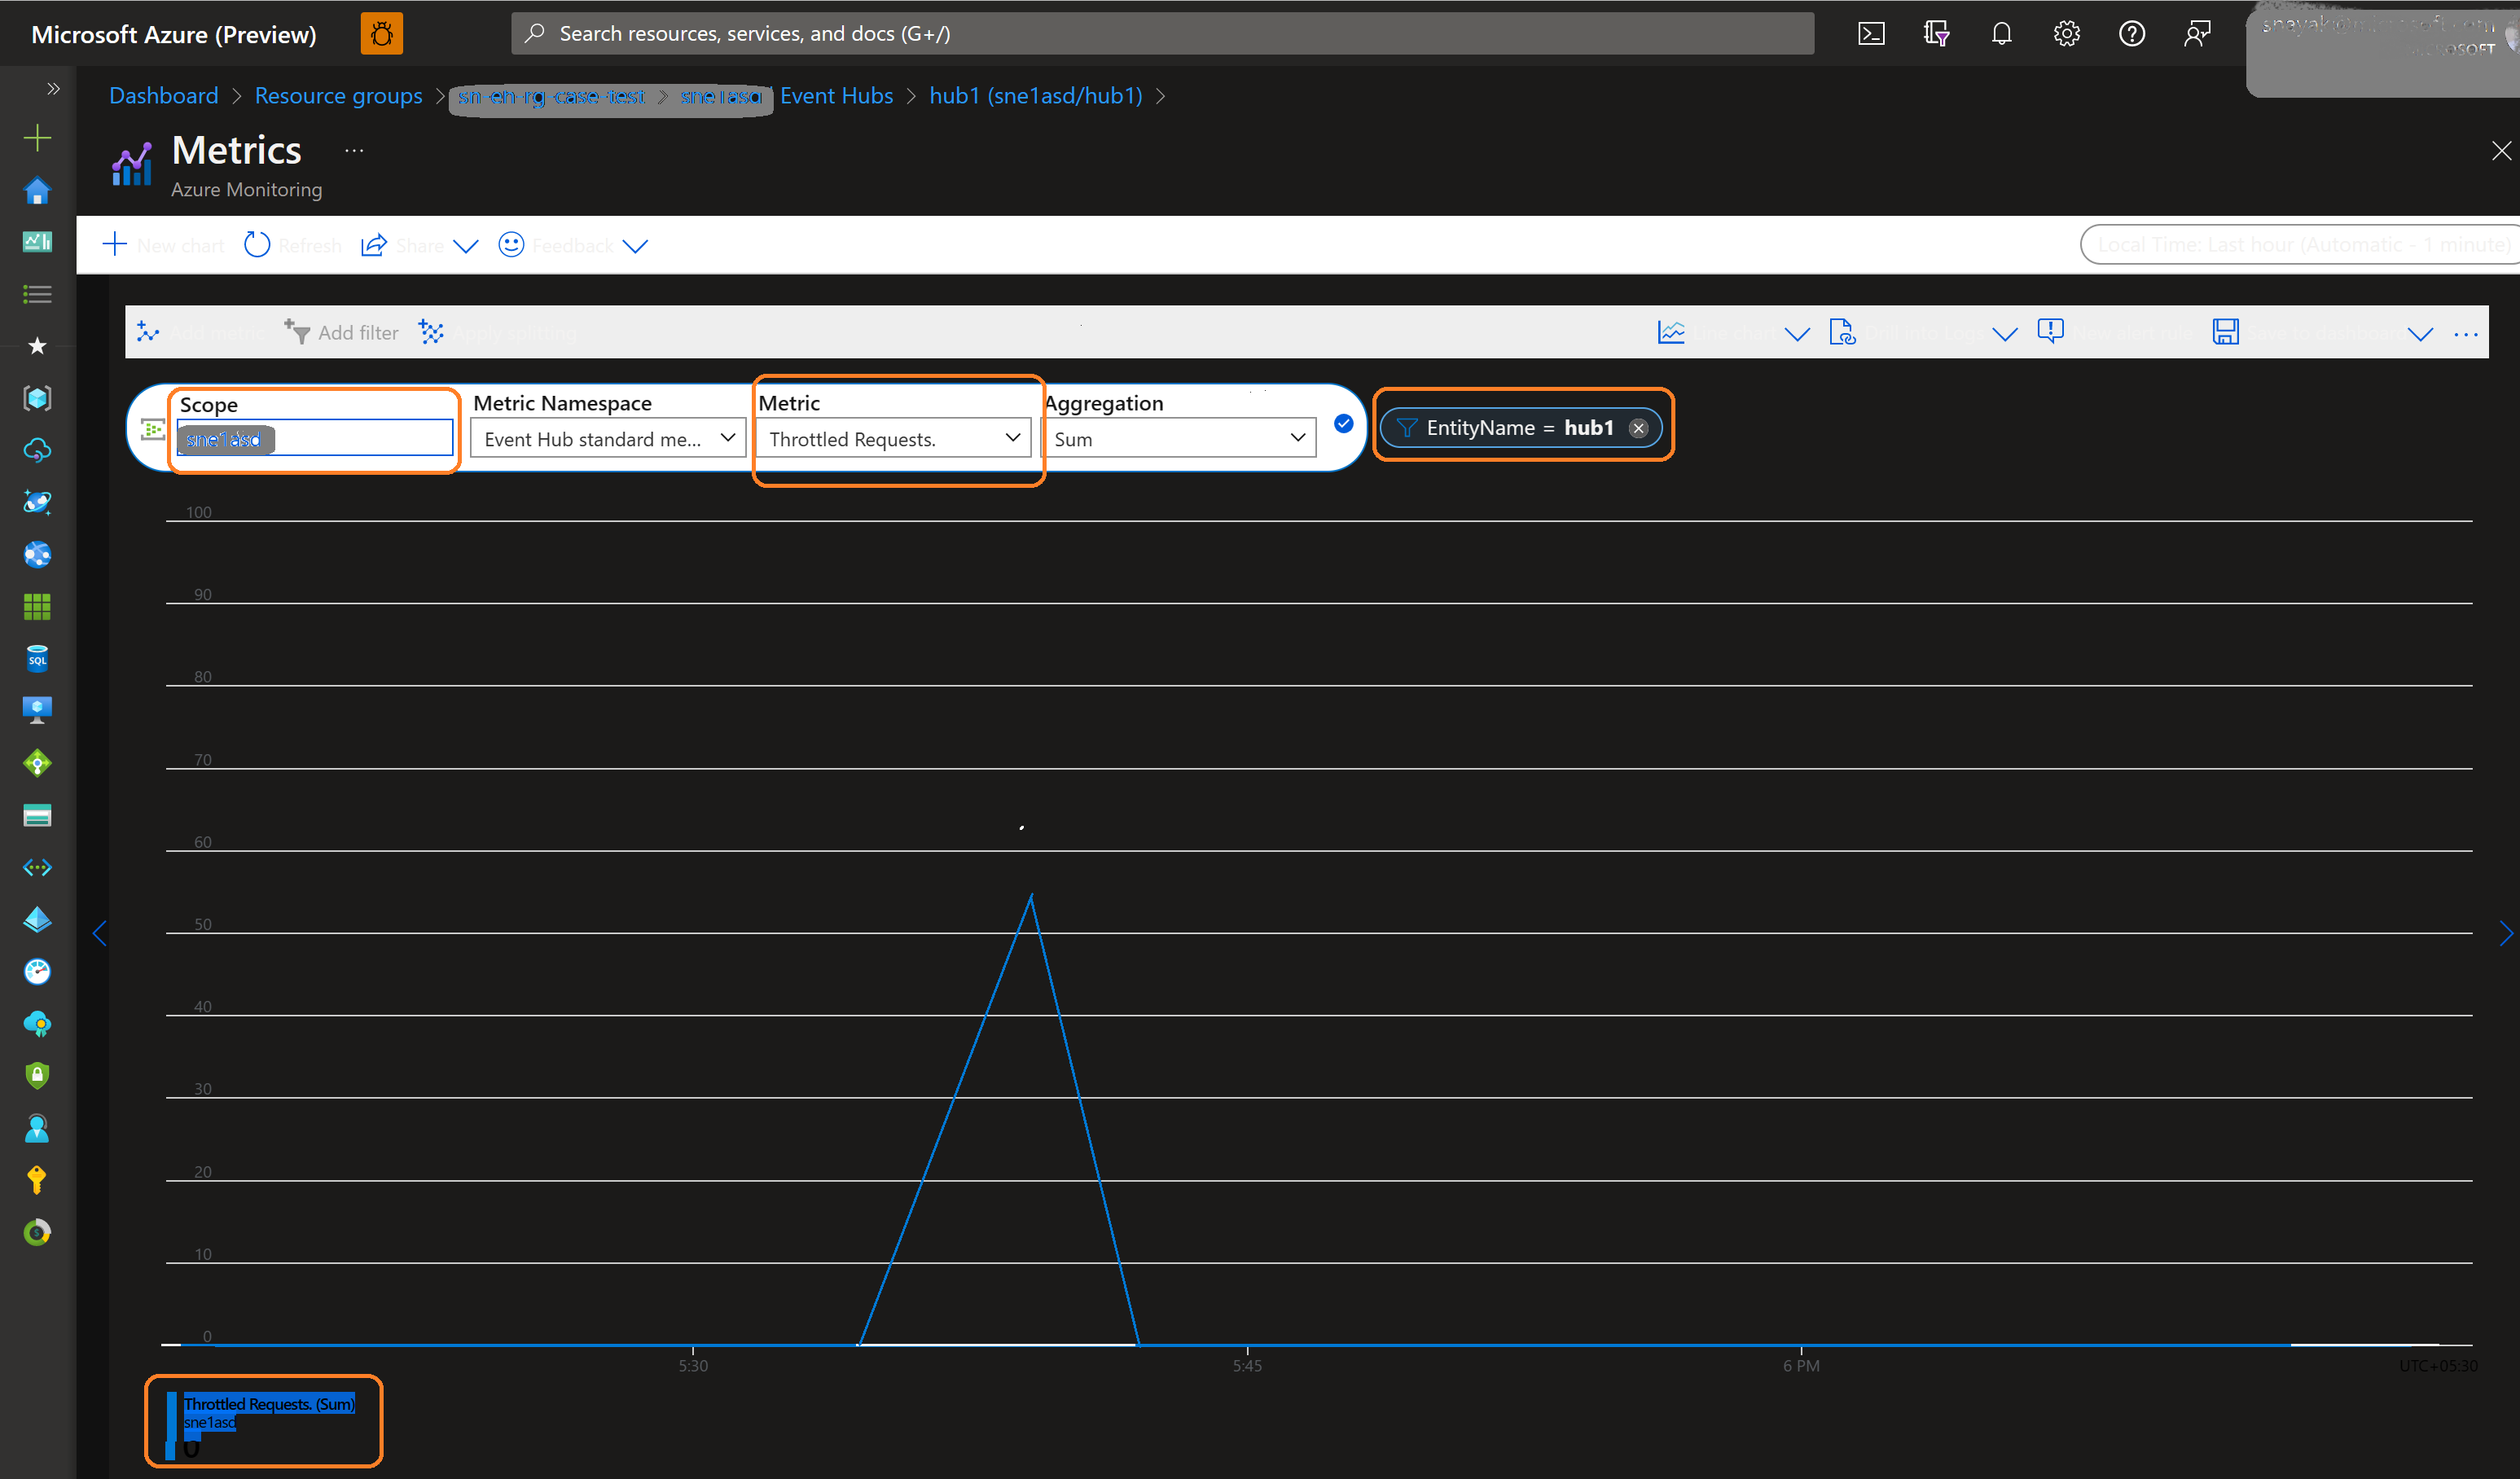
- Around the time, events are lost, check if the EH is encountering Throttling. If EH is throttled there is a good chance that events will be lost and missing.
- To check if the EH is throttling Navigate to your EH namespace in Azure Portal >> Metrics >> Add metric >> select Metric value as Throttled Requests >> Select relevant time duration.
Explanation:
Let us start by understanding the 3 services participating in the Diagnostic setup.
- Source service - This service is responsible to generate\emit the metrics\traces\logs. Most logs are emitted by default, and they will only be exported once customer configures the Diagnostic settings on the portal.
- Azure Monitor - This service is responsible to move logs from source to destination. The destination can be EH, LA, storage, etc.
- Destination (EH, LA, Storage) - These services are passive services i.e., it will receive whatever logs being streamed by Azure Monitor. It won’t alter payload, format, or anything. It just stores logs.
Throughput units (standard tier) is pre-purchased units of capacity that control the throughput capacity of Event Hubs. A single throughput unit lets you:
- Ingress: Up to 1 MB per second or 1000 events per second (whichever comes first).
- Egress: Up to 2 MB per second or 4096 events per second.
Beyond the capacity of the purchased throughput units, ingress is throttled and a ServerBusyException is returned.
If the user indiscriminately sends diagnostic loads of logs\traces\metrics to EH without consideration to its Throughput capacity\units, the EH will throttle the ingress data, and throw ServerBusyExecption. The common modus operandi is to space out the ingress request and retry the operations.
Please read the support statement from Azure Monitoring - Diagnostic settings in Azure Monitor states:
|
Possibility of duplicated or dropped data: Every effort is made to ensure all log data is sent correctly to your destinations, however it's not possible guarantee 100% data transfer of logs between endpoints. Retries and other mechanisms are in place to work around these issues and attempt to ensure log data arrives at the endpoint. |
What are the Alternative Options to minimize data loss during EH Throttling?
The simple answer is to avoid throttling.
- Using load and stress you can predict diagnostic setting traffic. You can then slightly overprovision for the TUs.
- Enabling Auto-Inflate feature can be one other option.
- You can create Azure Alert for Event Hub Throttling, and using EH APIs manually increase the TUs. (Similar to point 2).
- TUs are applied at the Namespace level, so consider creating multiple EH Namespaces for different diagnostics whenever possible – Shading.
Also, Ref:
Processing units (Premium tier) or Capacity units (Dedicated)
Diagnostic settings in Azure Monitor - Azure Monitor
Automatically scale up throughput units in Azure Event Hubs - Azure Event Hubs
Frequently asked questions - Azure Event Hubs
How exactly does Event Hubs Throttling Work? (Old Article)
Tags: Diagnostic Setting, Missing, Lost, Event Hub, Throttling.
Published on:
Learn more