Exploring Azure Firewall Policy Analytics

Written in collaboration with @ShabazShaik and @gusmodena.
Introduction:
Azure Firewall is a cloud-native and intelligent network firewall security service that provides the best of breed threat protection for your cloud workloads running in Azure. It’s a fully stateful firewall with built-in high availability and unrestricted cloud scalability. Multiple customers are looking for a feature that provides a centralized view of the Firewall rules and recommendations based on all the traffic passing through their Firewalls.
In this blog we will discuss in detail about the Policy Analytics which help you with enhanced Logging and Firewall rule management capabilities respectively.
Policy Analytics
Policy Analytics is a new feature released in Public Preview in July 2022, which provides insights, centralized visibility, and control to Azure Firewall, helping IT teams who have the challenge to keep Firewall rules up to date, manage existing rules, and remove unused rules.
You can refine and update Firewall rules and policies with confidence in just a few steps in the Azure portal. You have granular control to define your own custom rules for an enhanced security and compliance posture.
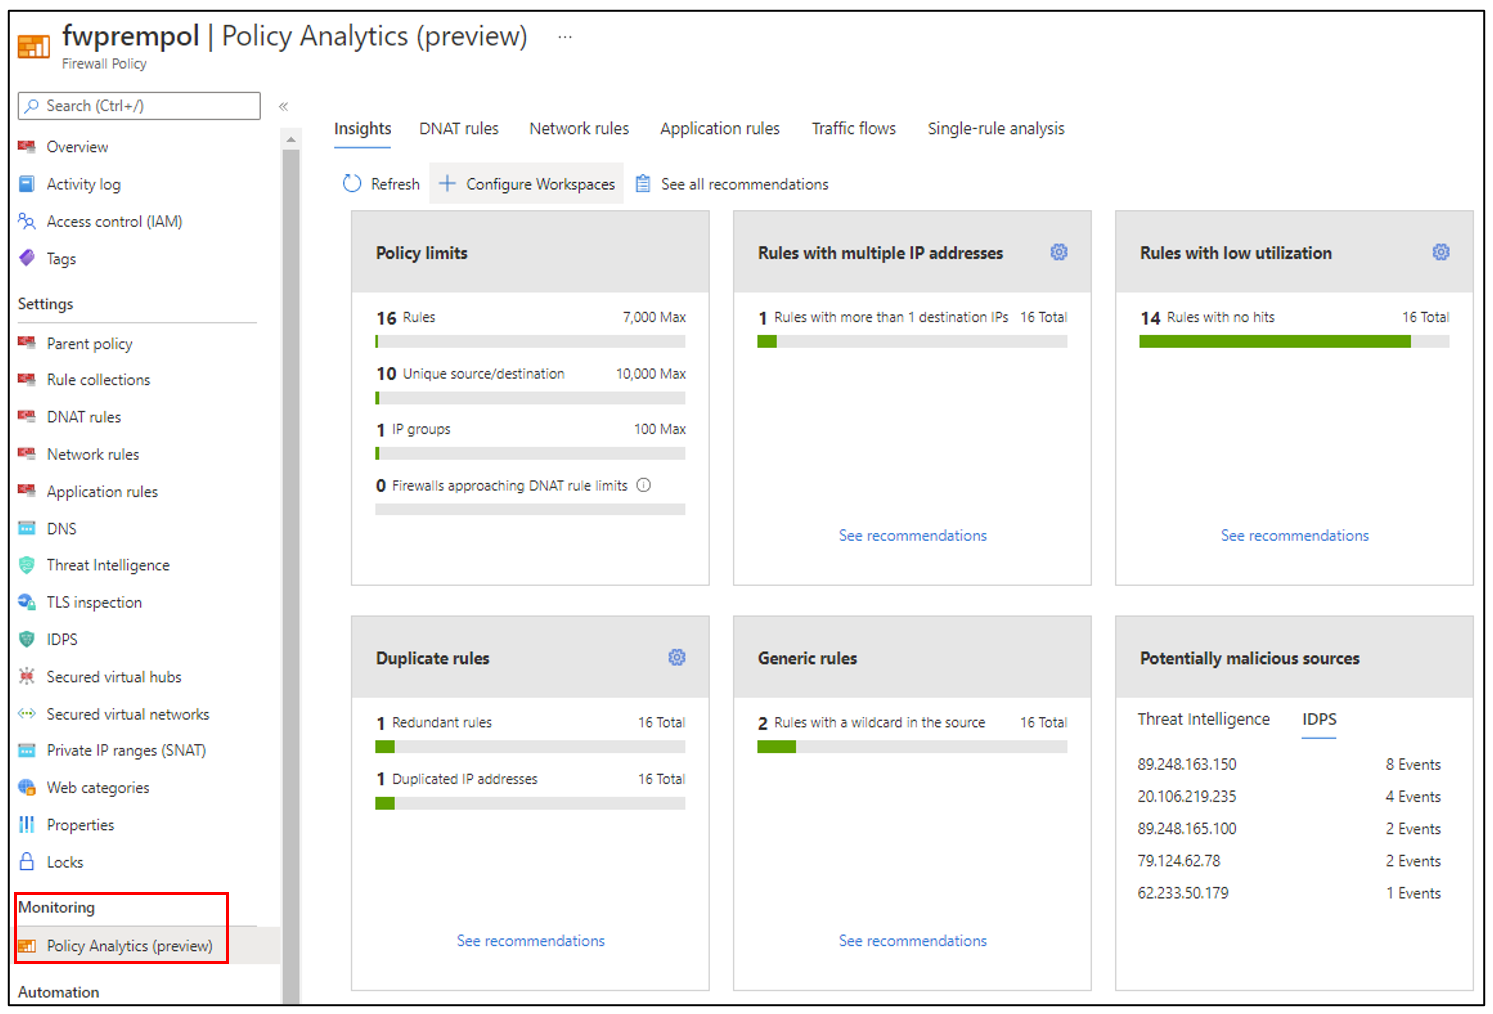
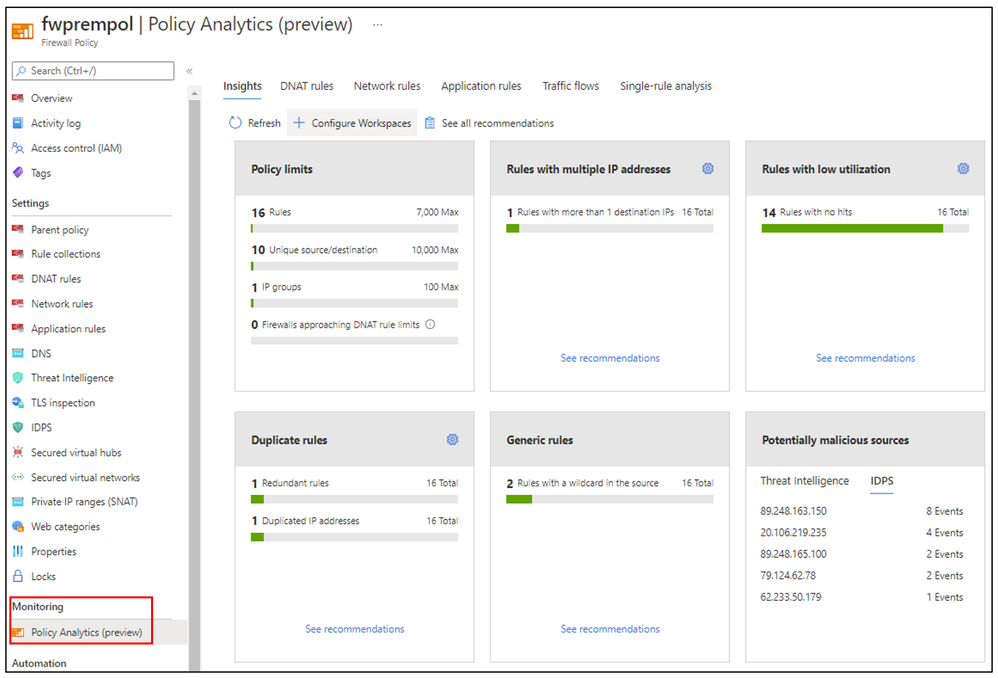
Policy Analytics is accessible via Azure portal under Firewall Policy/Monitoring, and the insights tab brings 6 interesting dashboards, aggregating insights, and highlighting relevant policy information.
These are the key Policy Analytics features:
- Policy insight panel: Aggregates insights and highlights relevant policy information.
- Rule analytics: Analyzes existing DNAT, Network, and Application rules to identify rules with low utilization or rules with low usage in a specific time window.
- Traffic flow analysis: Maps traffic flow to rules by identifying top traffic flows and enabling an integrated experience.
- Single Rule analysis: Analyzes a single rule to learn what traffic hits that rule to refine the access it provides and improve the overall security posture.
To enable Policy Analytics, you must meet the following prerequisites:
- Have an Azure Firewall Standard or Premium
- Have an Azure Firewall Standard or Premium Policy attached to the Firewall
- The network rule name logging preview feature must be enabled to view network rules analysis
- The structured firewall logs feature must be enabled on Firewall Standard or Premium
Policy Analytics starts monitoring the flows in the DNAT, Network, and Application rule analysis only after you enable the feature. It can’t analyze rules hit before the feature is enabled. Follow the steps below to enable Policy Analytics:
1. Enabling Network Rule Name Logging:
To enable the Network Rule name Logging feature, the following commands need to be run in Azure PowerShell. For the feature to immediately take effect, an operation needs to be run on the firewall. This can be a rule change (least intrusive), a setting change, or a stop/start operation. Otherwise, the firewall/s is updated with the feature within several days. Run the following Azure PowerShell commands to configure Azure Firewall network rule name logging:
2. Enabling Structured Firewall Logs:
With this new feature, you'll be able to choose to use Resource Specific Tables instead of the existing AzureDiagnostics table. In case both sets of logs are required, at least two diagnostic settings need to be created per firewall. By default, the new resource specific tables are disabled. Run the following Azure PowerShell commands to enable Azure Firewall Structured logs:
3. Enabling Policy Analytics:
Firewall with no Diagnostic settings configured:
- Once all prerequisites are met, select Policy analytics (preview) in the table of contents.
- Next, select Configure Workspaces.
- In the pane that opens, select the Enable Policy Analytics checkbox.
- Next, choose a log analytics workspace. The log analytics workspace should be the same as the Firewall attached to the policy.
- Select Save after you choose the log analytics workspace.
- Go to the Firewall attached to the policy and enter the Diagnostic settings page. You'll see the FirewallPolicySetting added there as part of the policy analytics feature.
- Select Edit Setting, and ensure the Resource specific toggle is checked, and the highlighted tables are checked. In the previous example, all logs are written to the log analytics workspace.
Firewall with Diagnostics settings already configured
- Ensure that the Firewall attached to the policy is logging to Resource Specific tables, and that the following three tables are also selected:
- AZFWApplicationRuleAggregation
- AZFWNetworkRuleAggregation
- AZFWNatRuleAggregation
- Next, select Policy Analytics (preview) in the table of contents. Once inside the feature, select Configure Workspaces.
- Now, select Enable Policy Analytics.
- Next, choose a log analytics workspace. The log analytics workspace should be the same as the Firewall attached to the policy.
- Select Save after you choose the log analytics workspace.
- During the save process, you might see the following error message: “Failed to update Diagnostic Settings”
Exploring Policy Analytics
Once all the prerequisites are done and the Diagnostic Setting is created, you will start seeing the dashboards being populated based on the Firewall Policy configuration and the logs available. In the insights tab you’ll find 6 dashboards:
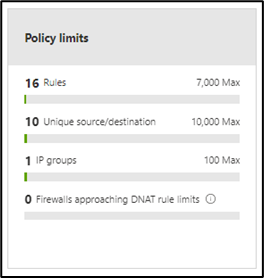
- Policy limits: This dashboard shows the overall limits of your policy as total number of rules, total number of unique source/destinations IPs, total number of IP Groups and DNAT rule limits.
- Rules with multiple IP addresses: Here you will find the rules with multiple IP addresses at source or destination field. The number of IPs which will trigger the recommendations is customizable between 1 and 100.
This dashboard helps you identifying what rules may use IP Groups instead of having multiple IP addresses in the source/destination.
- Rules with low utilization: A rule is considered to have low utilization when no hits are observed on some or all matching network flows over a period of time. You can select the time that you would like to use as a basis for generating recommendations.
- Duplicate Rules: This dashboard is customizable, and you may select the following options to show recommendations for:
- Two or more rules with exactly same values for all the parameters (except name)
- Two or more rules where the source or destination of one fully contains the others, and all other rule parameters match (except name)
- One rule with duplicate sources or duplicate destinations
By selecting “See recommendations” you’ll find details of duplicated IP addresses and redundant rules.
- Generic rules: Here you will learn what rules are using wildcard as source or destination IP addresses. By selecting “See recommendations” you will see what rules those are and what is the recommended action.
You can also click at the recommended action to run the single rule analysis.
- Potentially malicious sources: This dashboard shows traffic from malicious sources that are triggering Threat Intelligence and/or IDPS logs. By selecting “See recommendations” you will learn what action is recommended to prevent against potential threat detected.
Policy Analytics also provides visibility of all your DNAT, Network and Application rules in 3 different tabs. In these tabs you will see a column called “Matching flows” which shows you the total number of flows for each rule in a period of time.
The Traffic flows tab will give you more details of each flow like Rule Name, Source, Destination, Port, Protocol, Hit count and others. You can also change the filter to show the data for 10 min up to 30 days.
The last tab is for Single-rule analysis that can be used to analyze a rule and to learn what traffic hits that rule to refine the access it provides and improve the overall security posture. After running the analysis, you will find a rule summary and you will also be able to apply changes on the Port, Protocol, Source and/or Destination, delete the rule or move the rule to a lowest priority collection group.
Enabling Policy Analytics on a Firewall Policy associated with a single firewall is billed per policy as described on the Azure Firewall Manager pricing page. Enabling Policy Analytics on a Firewall Policy associated with more than one firewall is offered at no additional cost.
Conclusion:
As you have seen above, Azure Firewall Policy Analytics simplifies firewall policy management by providing insights and a centralized view to help IT teams to have better and consistent control of Azure Firewall.
Published on:
Learn moreRelated posts
Azure Data Studio is retired: Move your Azure SQL workflow to VS Code in 10 minutes
Azure Data Studio retired on February 28, 2026. The recommended path forward is Visual Studio Code with the MSSQL extension. If you used ADS d...
Axios npm Supply Chain Compromise – Guidance for Azure Pipelines Customers
On March 31, 2026, malicious versions of the widely used JavaScript HTTP client library Axios were briefly published to the npm registry as pa...
Azure MCP Server now available as an MCP Bundle (.mcpb)
Azure MCP Server is now available as an MCP Bundle (.mcpb), enabling one-click installation into Claude Desktop and other MCP-compatible clien...


