Mastering DP-500 Exam: R and Python Visuals in Power BI!

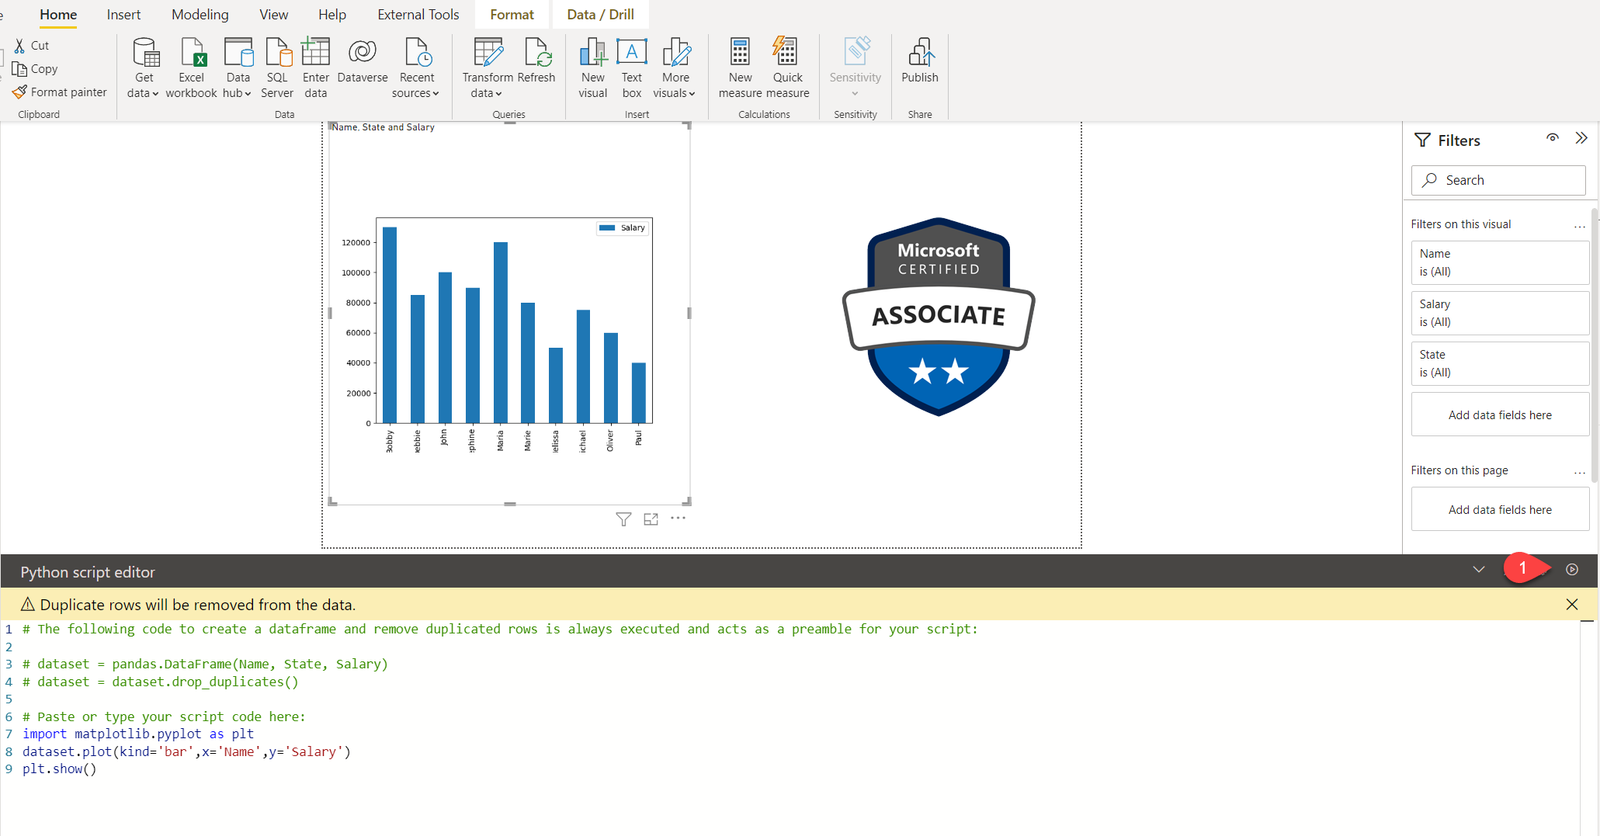
This article offers a step-by-step guide to seamlessly integrate R and Python into your Power BI solutions to advance your visualization efforts. If you're looking to create more advanced visuals for your Power BI reports, this article will enable you to leverage the power of R and Python to do so. By following the integration steps outlined in the article, you can create complex visuals and conduct more sophisticated analyses.
Whether you're looking to expand your Power BI visualization skill set or seeking to master the DP-500 exam, this article is an excellent resource. As you develop your data analysis skills, you'll find that integrating R and Python into your Power BI repertoire will help you stand out from the crowd and unlock new possibilities in data exploration.
So if you want to take your Power BI visualization capabilities to the next level, be sure to check out this article. It is packed with valuable information that will equip you with the tools you need to become a more effective data analyst.
The post Mastering DP-500 Exam: R and Python Visuals in Power BI! originally appeared on Data Mozart.
Published on:
Learn moreRelated posts
Data Visualization Technique in Power BI – Multi Measure Dynamic Visuals
In this blog post, you'll discover a powerful data visualization technique that will take your Power BI analysis to the next level — the...
Mastering DP-500: Identify Data Loading Bottlenecks in Power BI!
If you're dealing with slow data refresh in your Power BI dashboard, this article will help you identify the most common bottlenecks in the da...
Mastering DP-500 Exam: Analyze data model efficiency with VertiPaq Analyzer!
If you're looking to master the DP-500 exam, this post is your go-to guide for learning how to analyze data model efficiency with VertiPaq Ana...
Mastering DP-500 Exam: Optimize Data Model with Tabular Editor
For many data analysts, transforming unwieldy data models into sleek efficiencies is a time-consuming and often frustrating process. However, ...
Mastering DP-500 Exam: Performance improvements in queries and visuals!
If you're gearing up for the DP-500 exam, this post is a must-read. Delve into the realm of performance improvements in queries and visuals an...
Mastering DP-500 Exam – Aggregations in Power BI!
If you're looking to master the DP-500 Exam in Power BI, then this tutorial is just what you need! Aggregations are a key feature in Power BI,...
Mastering DP-500 Exam: Explore data using Spark notebooks!
If you're prepping for the DP-500 Exam or just looking for an easy way to visualize your data, Synapse Analytics Spark pool has got you covere...
Mastering DP-500 Exam: Explore and Visualize Data using Synapse SQL pane
If you're looking to quickly visualize data for your ad-hoc queries in Azure Synapse Analytics SQL pools, this tutorial is for you. Synapse St...
Mastering DP-500: Enable Personalized Visuals in Power BI!
If you're looking to give your report audience more control over how data is displayed, the Personalize Visuals feature in Power BI is here to...