Monitor and troubleshoot Azure & hybrid networks with Azure Network Monitoring

As customers bring sophisticated, high-performance workloads into Azure, there is a critical need for increased visibility and control over the operational state of complex networks running these workloads. Multi-cloud and hybrid network environments power new demands of remote work, 5G/Edge connectivity, microservices based workloads and increased cloud adoption. Although the advent of cloud has added agility, cost benefits, and made managing the infrastructure easier, the increasing complexity of IT with innumerable endpoints, devices and hybrid setup has drastically reduced cloud visibility. Management and monitoring of the network underlying these complex applications plays a key role in ensuring end user satisfaction.
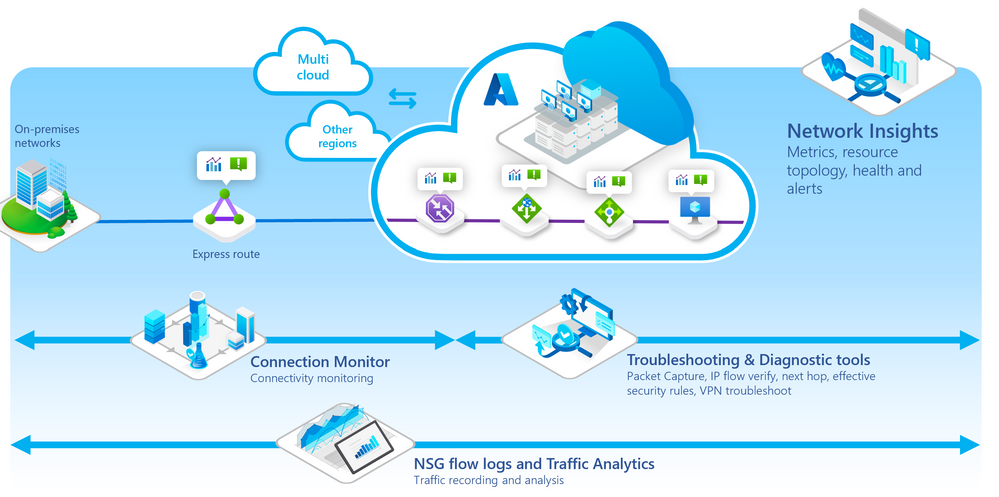
Azure Network Watcher and Network Insights portfolio encompasses an entire suite of tools to visualize, monitor, diagnose, and troubleshoot network issues across Azure and Hybrid cloud environments.
The suite enables customers to observe health across resources and networks with comprehensive wide coverage, through a guided and intuitive drilled down experience with Network Insights.
Moreover, users can detect and localize connectivity and performance issues across their Azure and Hybrid networks with synthetic monitoring in Connection Monitor.
Additionally, Traffic Analytics allows customers to visualize and manage their networks for uncompromised security, compliance issues, and understand the flow of network traffic.
Lastly, the Diagnostics suite offers fast troubleshooting with actionable insights, thus effectively assisting in reducing the meantime to resolve and mitigate network issues.
Contoso case study
To understand how the Network Monitoring portfolio facilitates reduction in the mean time to mitigate network issues, let’s dive deeper into the example retail chain Contoso’s use case.
What is Contoso?
Contoso is a retail chain whose workload sits both in Azure as well as on on-premises. In the past few years, they’ve experienced exponential growth and now serve over a million visitors per month. They have chosen the Azure Network Monitoring portfolio to monitor their hybrid platform, troubleshoot across their deployments, and effectively reduce the meantime to resolve network issues.
What does Contoso’s architecture look like today?
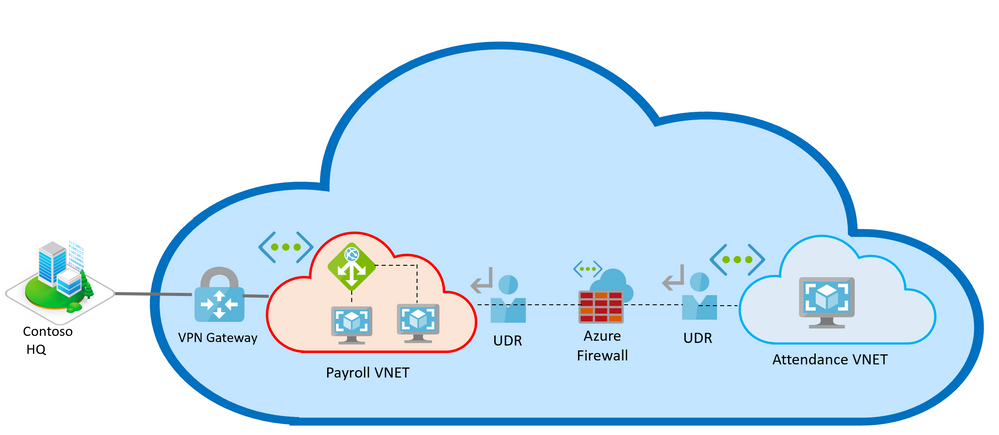
Contoso has the main web servers running on-premises, establishing connectivity to multiple VNETs deployed across Azure, hosted across a hub and spoke model, via VPN gateways. The incoming traffic across the Payroll VNET hosted at the hub is distributed with an Azure Application Gateway. The attendance VNET, calculator VNET etc. are deployed across multiple spokes and the traffic internally is routed with a Load Balancer across the VNETs.
Contoso also sees a huge volume of global traffic from random addresses, including malicious and unhealthy traffic. To avoid malicious attacks, there are Azure Firewalls and NSG rules deployed across the spokes.
What’s the problem?
Let’s consider the scenario during the month end.
To release the salary of the employees, Contoso Hotel needs to access payroll and attendance applications to calculate the salary of the employees, hosted in Azure, from the main headquarters hosted on-premises.
Due to huge volume of traffic at month end, the payroll application has stopped responding.
Moreover, Contoso is unable to retrieve attendance data from attendance application. These applications are hosted in Azure and now Contoso is unable to understand the reason behind these failures.
Our key users John and Jenny, the “network admins”, from IT dept, receive multiple complaints from the Contoso management and are informed that the applications are unreachable, and the issues need to be resolved immediately. At the same time, multiple alerts are fired across the systems stating that the time taken to access Payroll application is abnormally high and connectivity to Attendance application is constantly failing.
What’s the plan?
At first, the network admins would want to review the inventory of networking resources to understand the network flow, the dependencies in the network and the potential points of failure.
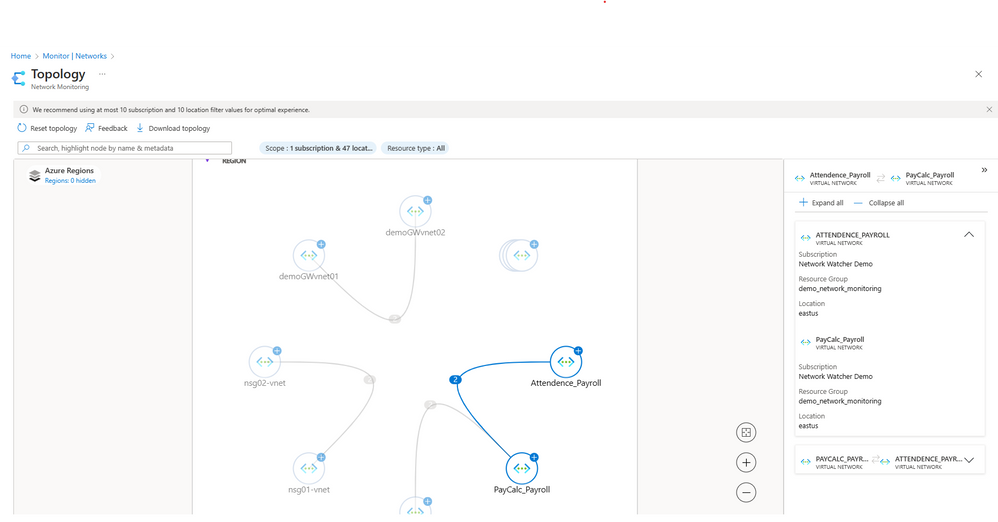
While the traditional method would be to review the offline architecture diagram and estimate probable points of failure, now this is achieved dynamically by Azure Resource Topology (ART). ART displays the entire deployed network architecture with networking resources spanning regions, resource groups and subscriptions connected as they are configured in Azure today. John drills down to each resource and investigates the interconnectivity amongst VNETs and resources, and understands their health status. Next hop integrated with ART allows John to test the communication and informs what type of hop is used to route the traffic across the entire network.
Figure 1 - Network Insights - Network Health page
Diagnose and Troubleshoot with the Network Watcher suite
Visualize network and resource health with Topology & Network Insights
John receives alerts stating unusual behaviour observed with performance metrics between payroll application and attendance payroll. The network admin navigates to Azure Network Insights to check the alerts. Based on the alerts and information captured from Network Insights, John navigates to ART and defines the scope of diagnosis. Within ART, John observes the health of the resources and sees multiple resources participating in establishing connectivity from Contoso Hotel to the application. John sees the health of an application gateway, a VPN gateway and the Payroll application VNET peered to the Attendance application VNET through an Azure Firewall via UDRs.
Figure 2 - Azure Resource Topology showing how Payroll and Attendance VNets are peered in Contoso network.
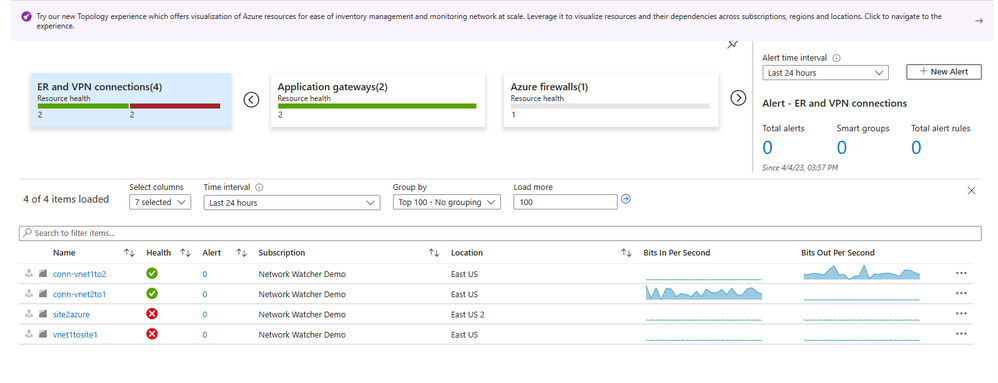
Clicking on the VPN gateway, John drills down on the resource where he extracts information for the health of the Gateway. He also checks if any specific alerts had been fired in the last 24 hours and observes alerts being fired for VPN Gateway degraded status.
Figure 3 - Network Health showing healthy and unhealthy VPN connections.
John observes throughput, response status, failed requests, and unhealthy host count. For further inspection, John goes to the dependency view for a detailed analysis.
John dives deeper into the dependency view of the VPN GW and observes that the Gateway health has been reported unhealthy for quite some time now. Similarly, John investigates the health status of all resources present in the network but is still not able to understand the cause behind the unavailability of the VNETs. Speculating that the health of the VPN GW might have resulted in high latency and loss of connectivity, John decides to troubleshoot further using diagnostic tools.
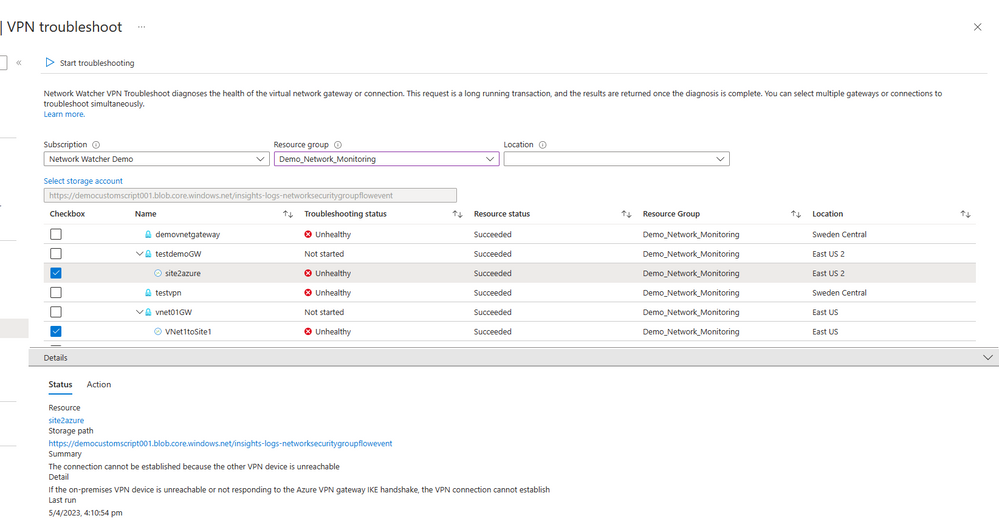
John attempts to access Payroll VNET, keeps encountering connectivity error while accessing from an on-premises machine. To mitigate this issue, John uses VPN troubleshoot which tries to establish connection to the Gateway and returns the error in connectivity along with the diagnostics and remediation steps. The VPN connection can’t be established due to pre-shared keys mismatch.
Along with the error, it has also returned an action item to verify that the pre-shared keys are the same on both on premises VPN device and Azure VPN gateway.
Figure 4 - VPN Troubleshoot showing the reasoning of the unhealthy troubleshooting.
Monitor and troubleshoot connectivity with Connection Monitor
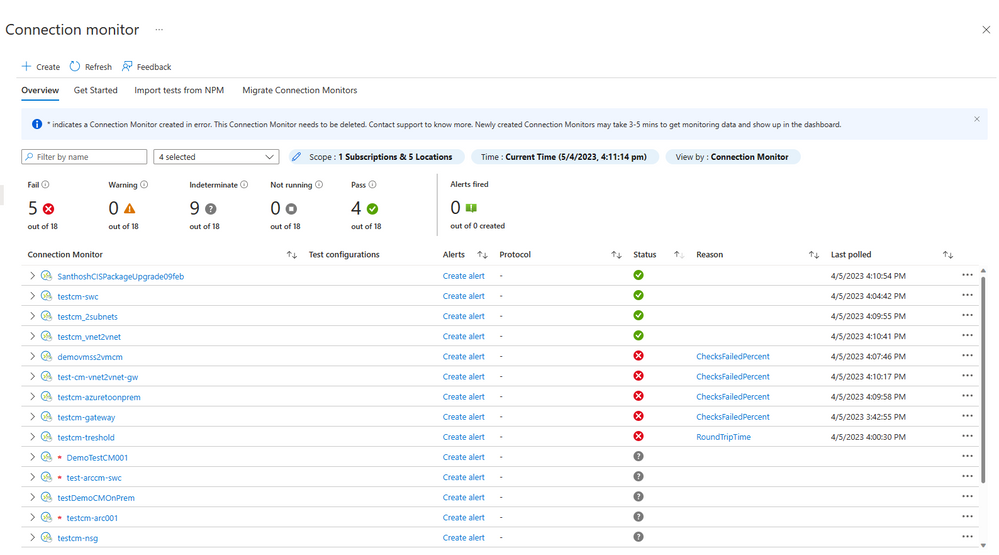
Meanwhile, Jenny receives multiple alerts fired from Connection Monitor detecting high packet loss between Payroll and Attendance VNET and detecting high latency while connecting to Attendance VNET, simultaneously. The alerts direct Jenny to the Connection Monitor dashboard, where she finds the connection monitor with their tests in failed status. She navigates to the CM overview dashboard where she studies the aggregated performance metrics across all test groups, identifying the top failing tests and localizing the problematic source and destination endpoints. Jenny also observes all attendance VNET tests displaying high latency. The test group reports a “CheckFailedPercent” error in the overview.
First, Jenny decides to troubleshoot the connectivity issue between Payroll and Application VNETs.
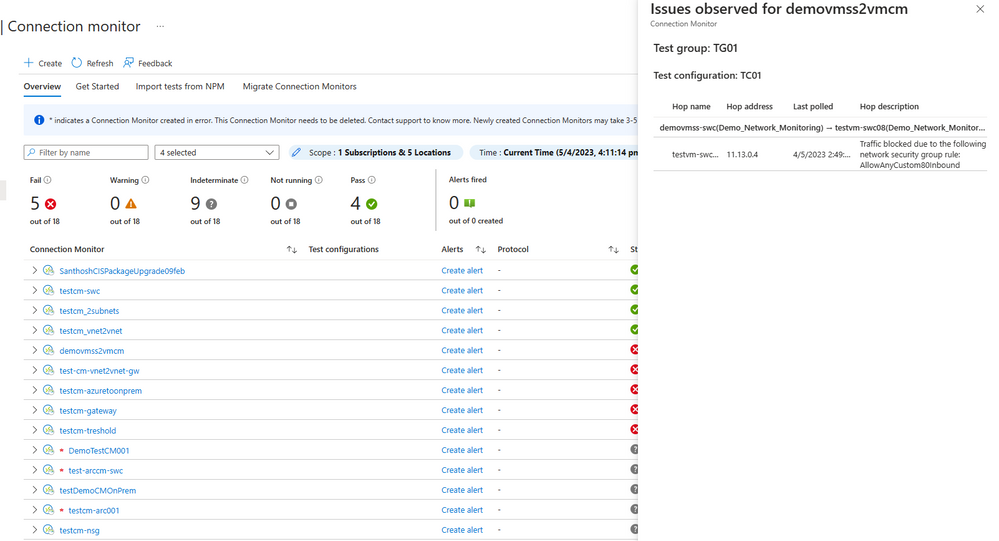
To localise the issue, Jenny navigates to the failing test topology where she observes 100% packet loss and 0 round trip time(RTT). The topology renders the end-to-end network path and localizes the issue to the destination VM. On dicing the data for a different snapshot of time, Jenny observes that at certain snapshots of time, there has been a complete loss of connectivity to the endpoint. Jenny navigates to the unified topology which shows network paths in red, indicating faulty connectivity. The hop details list the metadata and reports any issues and in this case it identifies a Network Security group (NSG) rule blocking the connectivity, displaying “Traffic blocked due to the following network security group rule: DefaultRule_DenyAllOutBound” and thus successfully troubleshooting the connectivity error.
Figure 5 - Connection Monitor checking constant connectivity showing three failed tests.
Figure 6 - Reasoning of failed connectivity tests (traffic blocked)
Jenny proceeds to change the NSG rule to allow outbound traffic and uses Unified Connection Troubleshoot (UCT) to check connectivity to the VNET on demand. UCT shows established connectivity without any failures, thus mitigating the issue successfully. Jenny navigates back to Connection Monitor and sees the connectivity test status as Pass with round trip time within threshold.
To investigate high latency to Attendance VNET and troubleshoot the cause, Jenny decides to study the flow of traffic across the VNETs.
What happens now?
Analyze traffic flow with NSG Flow Logs and Traffic Analytics
Jenny navigates to the Traffic Analytics dashboard to understand the distribution of traffic across Attendance VNET.
Figure 7 - Traffic Analytics homepage.
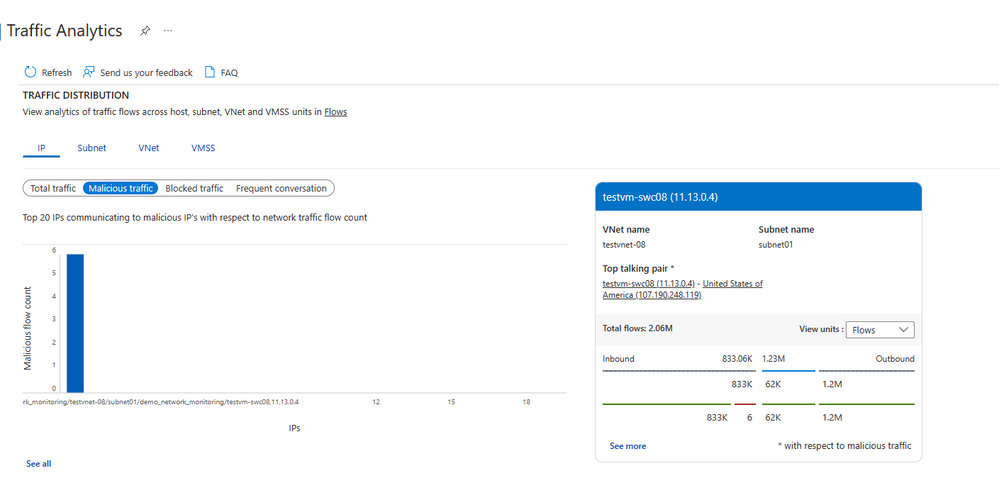
Navigating through the dashboard, she notes a spike in total inbound flows. She observes the Malicious traffic tab in Traffic distribution and observes increased inbound malicious traffic. She drills down and can query the list of malicious IPs that are tagged and investigates these IPs.
Figure 8 - IP having malicious traffic.
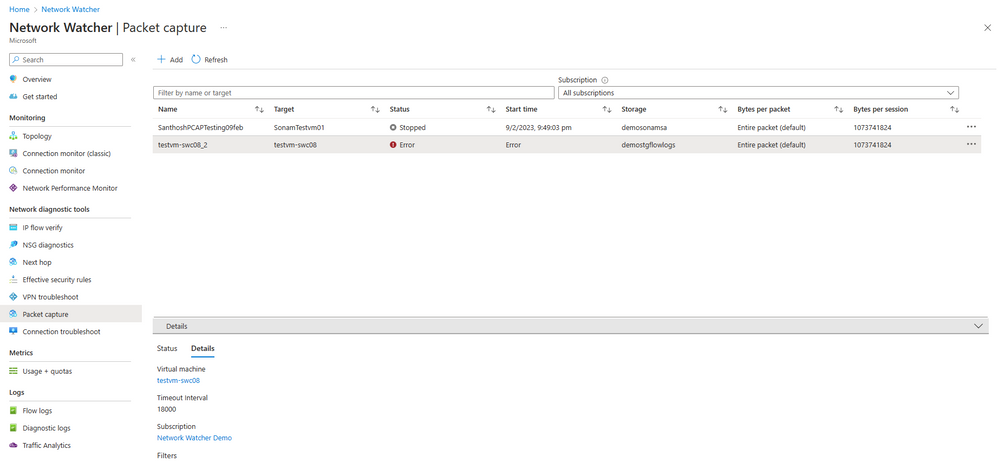
Jenny runs a packet capture to further understand the nature of communication of her workloads. She realizes the underlying connectivity misconfiguration leading to this and reroutes the traffic to the correct destination.
Figure 9 - Packet Capture showing error.
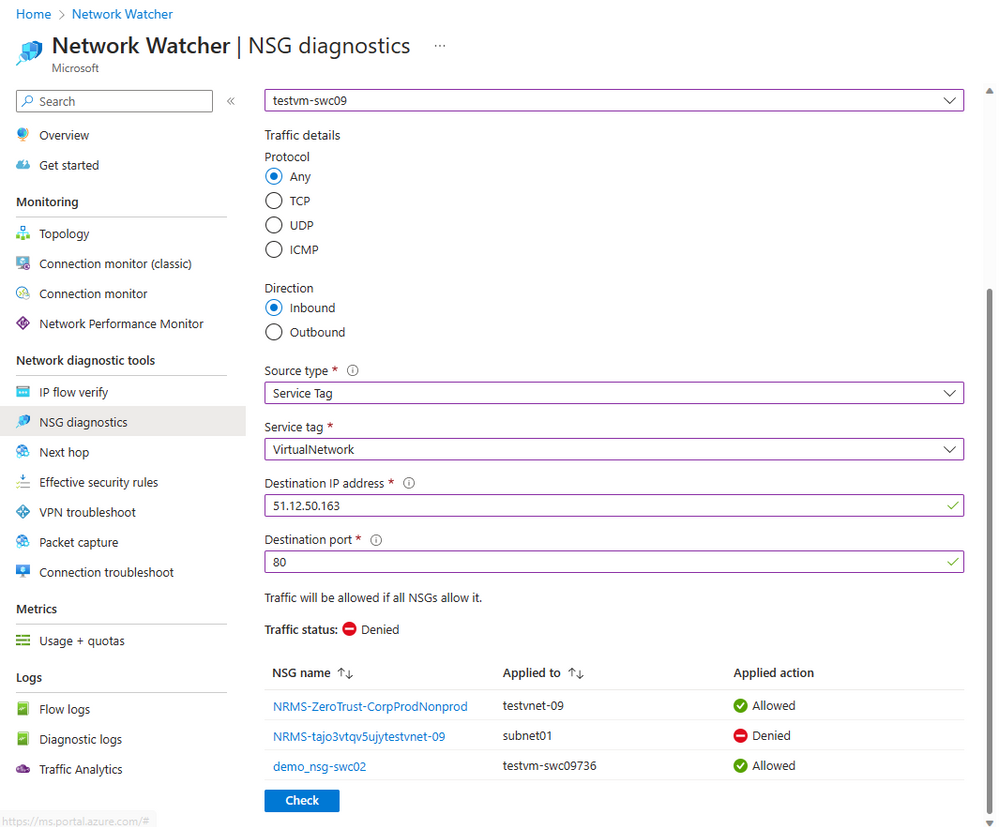
As part of the same investigation, Jenny also noticed a large number of blocked traffic in Traffic Analytics dashboard. With these insights, Jenny navigates to NSG diagnostics and after probing the network set-up for the applicable security rules, she updates her NSG rules to deny inbound and outbound traffic communicating with these malicious IPs.
Figure 10 - NSG diagnostics showing NSG blocking the traffic to the VM
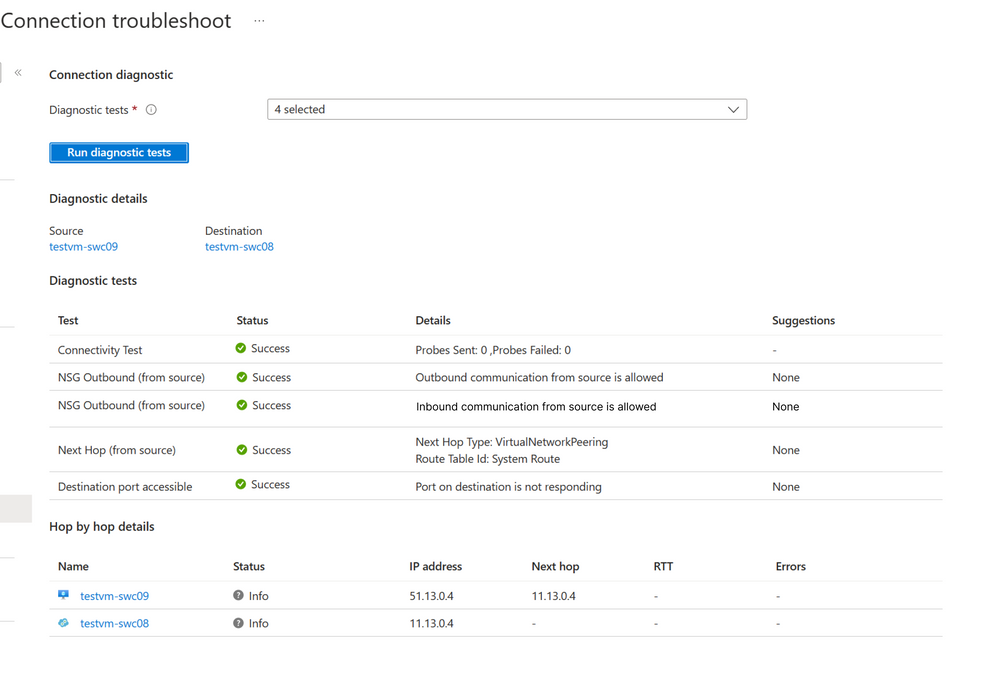
To close the loop on the network outage, the Network Admins run UCT across the VNETs. UCT integrates common troubleshooting tools like NSG checks, type of next hop from source and its reachability and scans port for reachability along with classic on-demand synthetic probing to holistically diagnose and troubleshoot connectivity issue. Once the connectivity across the resources is established without any reachability or blocking traffic issues, the admins circle back to the Network Insights dashboard.
Analysing the health of resources and observing the status to be healthy across the deployments, the admins close the ticket and mark the issue as resolved.
Figure 11 - Connection troubleshoot confirming the analysis done by showing all the successful and failed tests.
For more information, please refer - Azure Network Watcher | Microsoft Learn
Published on:
Learn moreRelated posts
Exponential backoff and circuit breaker for Service Bus-triggered Azure Functions
Use exponential backoff and circuit breaker patterns in Azure Functions with Service Bus SDK bindings. Control retry storms, protect dependenc...
May Patches for Azure DevOps Server
We are releasing new patches for our self‑hosted product, Azure DevOps Server. We strongly recommend that all customers stay up to date with t...
From beta to stable: Announcing the Azure SDK for Rust 🎉🦀
Announcing the stable release of the Azure SDK for Rust. This release includes stable libraries for Core, Identity, Key Vault (Secrets, Keys, ...
