Embed a Power BI Report as a System Dashboard in Dynamics 365 CE Using Environment Variables

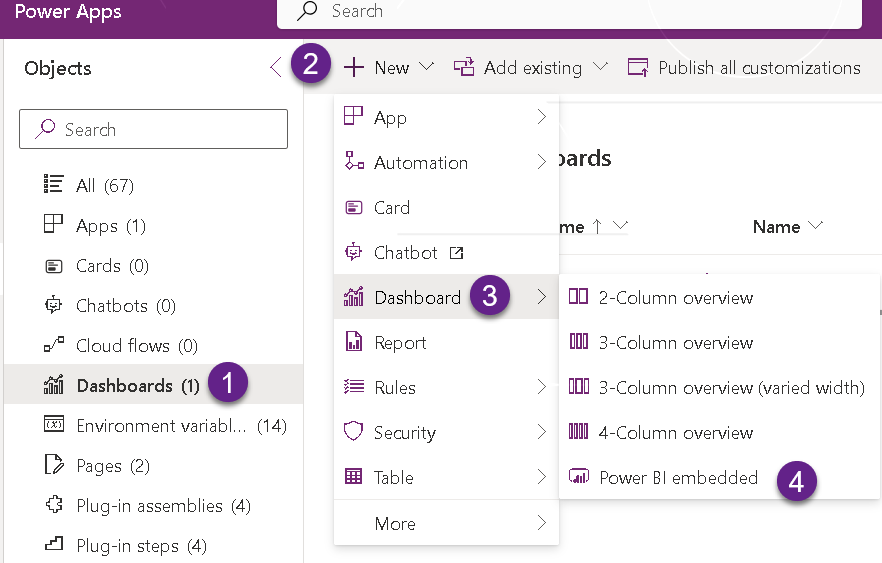
Integrating Power BI with Dynamics 365 CE can elevate your decision-making processes by providing seamless access to actionable insights. This article walks you through the process of embedding a Power BI report into Dynamics 365 CE as a system dashboard. Doing so allows users to access critical data without leaving the CE interface, making their job easier and more efficient. By following the steps outlined in this guide, you'll be able to take advantage of the powerful analytical capabilities of Power BI within the familiar confines of Dynamics 365 CE.
So, if you're looking to streamline your data analytics processes and make informed decisions quickly and efficiently, be sure to check out this guide for embedding a Power BI report as a system dashboard in Dynamics 365 CE.
Published on:
Learn moreRelated posts
Power BI Dashboards vs Reports: Understanding the Key Differences
If you're navigating the world of data analysis with Power BI, it’s important to understand the key differences between dashboards and reports...
Interconnected Dynamics: The Power of Connections in the Dynamics CE
Interconnected Dynamics is a powerful feature of Microsoft Dynamics 365 Customer Engagement (CE). It enables the creation and viewing of relat...
Difference between business intelligence and predictive analytics
Business intelligence (BI) and predictive analytics are two distinct approaches to handle, categorize, and understand data. While BI involves ...
Dynamics 365 CE and Shopify Integration Options
If you're seeking to integrate Dynamics 365 Customer Engagement (CE) with Shopify, there are numerous options available. For those unfamiliar ...
Power BI Dashboards for Business Central Reporting
Microsoft, a technology giant renowned for developing robust business systems, has recently launched an Enterprise Resource Planning (ERP) sol...
Unleash your Dynamics 365 Data with Azure Synapse Analytics and Power BI
If you're looking to maximize the value of your Dynamics 365 data, this video tutorial is a must-watch. Here, you'll learn how to leverage the...
Charity Hub CRM - Reporting & Analyics with Excel and Power BI Integration
This video provides insights into how Charity Hub CRM integrates with Excel and Power BI to support organizations in reporting and analytics. ...
Exploring sales usage reporting feature in Dynamics 365 CE sales analytics
Microsoft is constantly improving the reporting capabilities within Dynamics 365, and one of the latest features is the sales usage reporting ...
Charts and Dashboards in Dynamics 365
Are you using Microsoft Dynamics 365 and wondering how to best utilize charts and dashboards for reporting and data analytics? In this post, t...