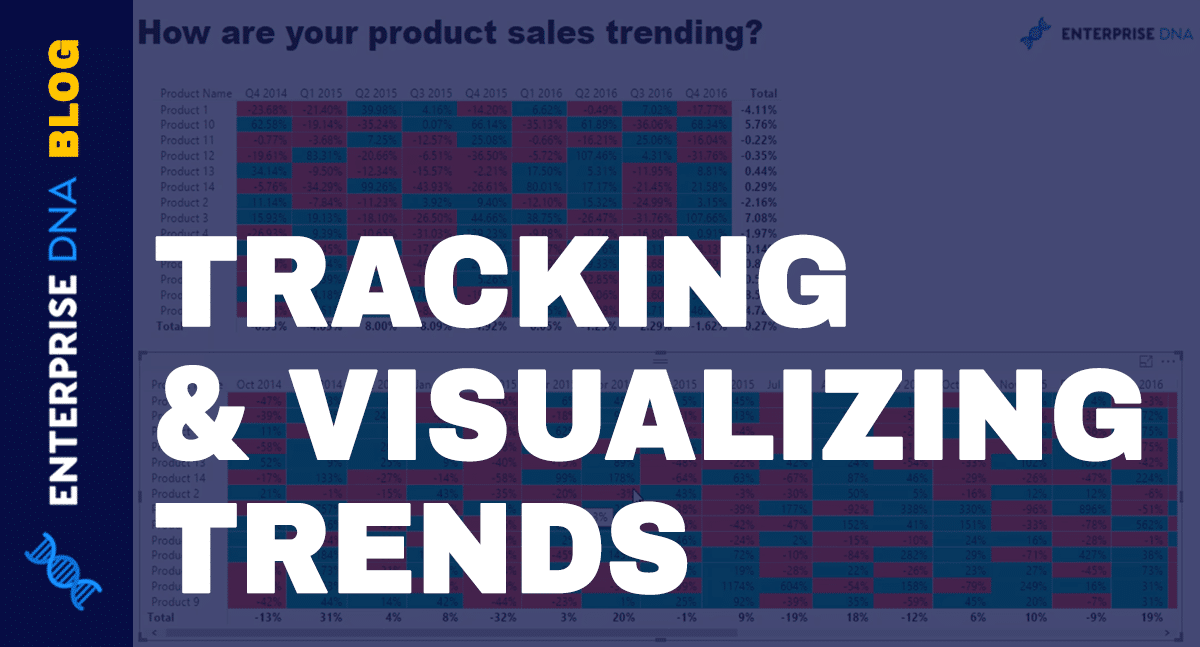
Tracking Trends in Power BI Using DAX Formulas

If you want to add value to your audience and stakeholders, tracking trends in Power BI can be an effective technique. This post delves into the use of DAX formulas to showcase such insights with conditional formatting inside Power BI tables. With this approach, growth trends can be accurately calculated and presented in an easy-to-understand visual format that can help guide decisions.
By showcasing trends and how they change over time with clear visuals, businesses and decision makers alike can gain valuable insights. With the help of DAX formulas, Power BI becomes a powerful tool for trend analysis. This blog post demonstrates how you can leverage the capabilities of Power BI in this regard, while adhering to the best practices of data visualization.
So whether you're new to Power BI or an experienced user looking to up your game, this post offers insights on how to effectively leverage DAX formulas to communicate trends in an engaging manner.
The post Tracking Trends in Power BI Using DAX Formulas first appeared on Master Data Skills + AI.
Published on:
Learn moreRelated posts
Data Visualization Technique in Power BI – Multi Measure Dynamic Visuals
In this blog post, you'll discover a powerful data visualization technique that will take your Power BI analysis to the next level — the...
Creating A Pareto Chart In Power BI – Advanced DAX
Learn how to create an impressive Pareto chart using advanced DAX formulas with this tutorial. This blog tutorial showcases an interesting Par...
Power BI Data Model For Advanced Scenario Analysis Using DAX
Discover the full potential of Power BI as an analytical tool with this tutorial focusing on developing a data model tailored for advanced sce...
Revenue Forecast Technique for Project Data – Power BI Insights With DAX
If you are looking to utilize project or opportunity data to create a revenue forecast in Power BI, then this tutorial is perfect for you. In ...
Data Model For Power BI Retail Sites Dashboards
For those looking to develop a comprehensive data model for their Power BI Retail Sites Dashboards, this tutorial is for you. With expert guid...
Optimize Power BI Formulas Using Advanced DAX
If you're looking to optimize your Power BI formulas, this tutorial on advanced DAX usage is for you. The tutorial covers several table functi...
What Is Power BI Used For?
Power BI is a powerful tool for analyzing and visualizing data that is essential in today's dynamic and data-driven business landscape. It is ...
18 Incredible Power BI Dashboard Examples
If you're looking for inspiration for your Power BI dashboards, this post has got you covered. Here you'll find a curated list of 18 incredibl...
Conditional Formatting with Transparency Hex Codes
Conditional formatting can be effectively implemented using transparency hex codes in field values. This tutorial explores the advantages of u...