Azure Monitor Availability alerts using Resource Graph Queries

We recently announced how you can use Azure Log Analytics to create alerts on Azure Resource Graph queries. Here, I wanted to discuss possible scenarios and examples on how this can be used to check the availability for services across Azure and even on Azure Arc enabled resources.
Azure Resource Graph queries
Azure Resource Graph is a service within Azure that enhances Azure Resource Management. It allows you to explore resources efficiently and quickly by running queries across a specific group of subscriptions. These queries are written in the Kusto Query Language (KQL), which is a widely used format with other Azure services like Log Analytics.
Trivia: Most of the screens you see on Azure portal give you an option to check the KQL query behind getting that data.
Using Graph queries to generate alerts
Earlier, it was only possible to generate alerts using Log Analytics queries or Metrics. Now, the alerts can be generated on Azure Resource Graph queries. This can really help with setting up the availability alerts for most of the Azure services. Let us take a look at it with some examples.
SQL Managed Instance Availability
SQL MI supports various types of Metrics and Logs with Azure Monitor. However, sometimes, customers only want to receive a simple alert on whether the instance is up or down. ARG query can let you know the state of the instance which can be further converted to an alert.
The above query can give you the current state of the SQL MI instance.
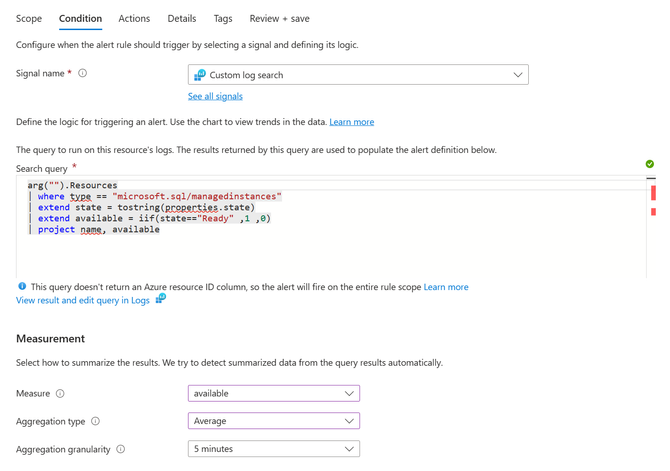
Now, this same query can be converted to an alert. The idea is to check if the SQL MI instance is in any other state than “Ready” and generate the alert. For this, we can write something like this:
Result:
To convert this into an alert, go to Monitor – Alert Rules section and create a new one.
You will have to select a Log Analytics workspace (logs are not stored in LA workspace, it is only used to generate the alerts) as the scope.
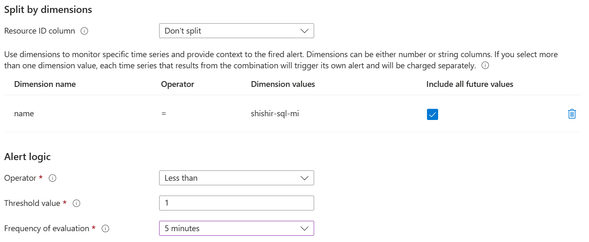
On the Conditions page, configure the following:
If you look in the configuration, we are checking the average of “available” parameter every 5 minutes and if it is anything less than 1, then an alert can be triggered.
The rest of the alert’s screens are standard. You can set up an email alert, or call a webhook or Logic App etc.
Conclusion
You can use the above logic to get details on Azure and Azure Arc enabled resources and create alerts from the same. For e.g. to generate an alert for Azure Arc enabled servers on their connection state, this can be used:
Published on:
Learn moreRelated posts
General Availability of SharePoint Framework 1.23 – Advancing the modern developer experience
We are excited to announce general availability for the SharePoint Framework 1.23. We are rolling out new features in extensions, preview of n...
Microsoft 365 Copilot: Copilot chat pane and Summary feature in OneNote Mobile (iPhone)
Microsoft 365 Copilot introduces a new chat pane and Summary feature in OneNote Mobile (iPhone) for licensed users, enabling AI-generated summ...
Action required: Upgrade macOS 13 devices to maintain Teams desktop access
Microsoft Teams will stop desktop client updates for macOS 13 starting May 2026, with upgrade notifications in June and blocking access by mid...
Microsoft 365 Copilot (including Copilot Chat): Admin notifications for Copilot mobile app on macOS
Microsoft 365 Copilot now offers admins on macOS a Mobile card in the Copilot Control System to notify users about the approved Copilot mobile...
Microsoft 365 Copilot: Admins can manage agents at scale with bulk lifecycle actions
Microsoft 365 Copilot now supports bulk lifecycle management of agents in the Microsoft 365 admin center, allowing admins to perform on-demand...
Microsoft Teams: Scoped Search for SharePoint app in Teams (Viva Connections)
With this feature, users accessing search through the Teams search icon while within the SharePoint app in Teams (Viva Connections) will be ab...
Microsoft Purview: Data Loss Prevention to restrict processing external emails in Microsoft 365 Copilot and Copilot Chat
We are expanding Microsoft Purview DLP for Microsoft 365 Copilot and Copilot Chat to safeguard risks from external emails. This real-time cont...
Microsoft Viva: Fresh Copilot Metrics in Custom Person Queries & Reports- Viva Advanced Analysis
Key Microsoft 365 Copilot metrics in custom person queries and reports will have values up to 2-3 days old from the current date. This will pr...
Microsoft Copilot (Microsoft 365): SharePoint list support in Agent Builder
Agent Builder now supports using a SharePoint list as a knowledge source for agents in Microsoft 365 Copilot. Makers can ground an agent in st...
Microsoft Edge: Allow M365 authentication popups in work profiles
When users are signed in with a work account, some Microsoft 365 sites (for example, microsoft.com, cloud.microsoft, and microsoft365.com) may...


