Business Impacts to Healthy Cloud Monitoring

Within the past decade, cloud computing has revolutionized digital transformation. Benefits such as enhanced performance, ability to scale, and improving costs are key reasons that IT decision-makers migrate to the cloud. One critical component of enabling businesses to take full advantage of the cloud is observability. Properly monitoring your cloud environment expedites the identification and resolution of incidents that occur. This post aims to provide an introduction of operational analytics by exploring observability, monitoring, incident response, and how correctly instrumenting your environment with these components benefits your company.
Observe
Mature observability of metrics, logs, and errors enables your business to track the health of your cloud environment. When ingesting the correct data in real-time, internal teams such as site reliability engineers (SRE) can quickly act to resolve issues and potential security threats to prevent downtime and any compromise to your data. As a result, speed to resolution, productivity, and measurement goals, such as service level objectives (SLOs), can be maintained, if not improved, over time.
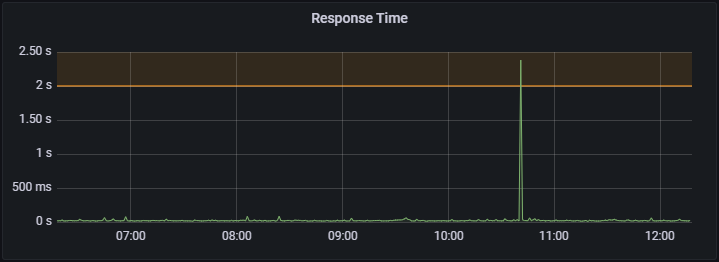
Figure 1. Response times for a web page that has a predefined performance goal of less than 2 seconds. However, response times
between 2 and 5 seconds is acceptable. Response times greater than 5 seconds are indicated by a red line (not shown) and are unacceptable.
Monitor
Simply implementing a logging sink is not enough. A business must adopt a strong monitoring practice. Such practices involve defining business objectives in the form of key performance indicators (KPIs) and the use of cloud monitoring tools, such as Azure Monitor or Grafana, to visualize and quickly identify changes. Specific KPIs are prioritized based on your business goals and needs. Important KPIs include mean time to identify (MTTI) and mean time to repair (MTTR). These KPIs measure the average time to identify an incident and the average time from when an incident occurs to when it is resolved. Strong monitoring aims to reduce these times as much as possible, as these indicators provide critical insights into the health and reliability of your system. SRE teams engage in the monitoring and tracking of these indicators to drive success in terms of reliability and performance.
Figure 2. Monitoring the number of compute instances deployed within an automatically scalable environment. The predetermined
thresholds are 1-5 instances (acceptable), 6-7 instances (warning), and 8-10 instances (critical).
Figure 3. Monitoring the load of a Cosmos DB instance with predetermined thresholds.
Act
Logging systems and monitoring platforms in and of themselves are only the beginning. Another key element of a solid observability story is configuring automation and alerting. Once a cloud monitoring tool identifies an issue or potential threat and the team is alerted, SREs can rapidly determine a solution and act accordingly to minimize downtime and risks to your customers. An example incident could be a security breach. As a result of instant alerting through strong monitoring practices, SREs can rapidly act to fix any configuration and security issues that have occurred, minimizing a breach or, worse, preventing data theft. When proper alerting through well-configured cloud monitoring tools and efficient resolution processes have been implemented within your environment and team, reliability and security are maintained, thus improving the customer experience and growing revenue for your business.
In the below figures, a stress test has been performed on the system. From the graphs, one can see that the compute instances performed fine without much need to scale. However, the request units (RU/s) reached capacity and, therefore, the system failed. In such a case, SREs and database engineers should be immediately alerted, and actions should be performed to ensure that the system can handle future load.
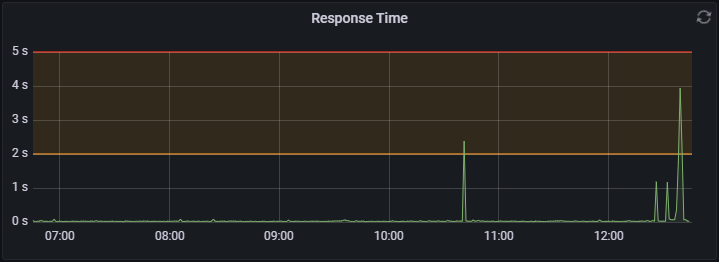
Figure 4. Page response time has decreased to approximately 4 seconds (acceptable per SLO, but not ideal).
Figure 5. Under current load, compute resources have scaled to 4 instances (still within the acceptable threshold).
Figure 6. Under the current load, critical stress levels have been placed on the Cosmos DB instance and the application, therefore, has failed.
Figure 7. The failure event of the Cosmos DB instance (zoomed in) shows that downtime lasted approximately 5 seconds.
Adopting the cloud can introduce many benefits, along with a few new challenges, to any business. Compared to on-premises infrastructure, cloud computing offers increased reliability, scalability, and security for your workloads. In the end, any company who is serious about maximizing uptime, reducing threats, and realizing cost efficiency in operations should follow the three steps above—observe, monitor, and act—when architecting an observability strategy.
About the Author
Kirt Patel is a business-focused CSA intern with Microsoft's Customer Architecture and Engineering team. This fall, he will be a senior at the University of Southern California where he is currently studying International Relations, Business, and Data Science. His passions include business optimization through observability and machine learning.
Published on:
Learn more


